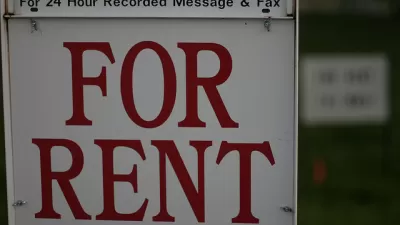
Amid the ubiquitous, and inconsistent, reportage on rising rents and housing prices, a guide from City Observatory helps point readers toward the most accurate numbers.
The urgency of housing costs in the United States prompts the need for facts and figures, and the abundance of online real-estate listings would seem to provide. But as the statistics pile up, it's worth remembering that more numbers doesn't mean good numbers.
Daniel Hertz at City Observatory wrote about the need for journalists and would-be-informed citizens to judge the viability of median rental statistics, and followed up with a guide for assessing the reliability of data and its sources.
The guide compares the practices a few mainstay sources of rental data, like HUD and Zillow, and offers general advice for assessing the myriad other sources a reader could encounter.
One takeaway: A simple average of all available listings may be less straightforward than you think.
According to Hertz, averages may be skewed toward the high end of the rental market for a number of reasons: for instance, low-rent apartments or even whole neighborhoods may be underrepresented on many sites, while high-rent units tend to stay listed, and thus present in the data set, for longer.
Another solid tip: Read the fine print. You may not be able to grade the math in every study, but a serious source should certainly be able to offer an explanation as to how it accounts for the kinds of factors Hertz brings up.
FULL STORY: Here’s your definitive field guide to median rent statistics

Montreal Mall to Become 6,000 Housing Units
Place Versailles will be transformed into a mixed-use complex over the next 25 years.

Planetizen Federal Action Tracker
A weekly monitor of how Trump’s orders and actions are impacting planners and planning in America.

DARTSpace Platform Streamlines Dallas TOD Application Process
The Dallas transit agency hopes a shorter permitting timeline will boost transit-oriented development around rail stations.

Interactive Map Reveals America's “Shade Deserts”
Launched by UCLA and American Forests to combat heat-related deaths, the tool maps the shade infrastructure for over 360 U.S. cities.

Bicycles and Books — In Sacramento, Libraries Now Offer Both
Adult library card holders can check out e-bikes and e-trikes for up to one week.

Colorado Landfills Emit as Much Pollution as 1M Cars
Landfills are the third-largest source of methane pollution in Colorado, after agriculture and fossil fuel extraction.
Urban Design for Planners 1: Software Tools
This six-course series explores essential urban design concepts using open source software and equips planners with the tools they need to participate fully in the urban design process.
Planning for Universal Design
Learn the tools for implementing Universal Design in planning regulations.
City of Mt Shasta
City of Camden Redevelopment Agency
City of Astoria
Transportation Research & Education Center (TREC) at Portland State University
US High Speed Rail Association
City of Camden Redevelopment Agency
Municipality of Princeton (NJ)


