


Google's Popular Times can contribute toward better car parking and street planning, but it also has the potential to radically change how we plan.

These days we hear a lot about the potential benefits to planning of ‘big data’. With most people walking, cycling, taking transit or driving around with a smartphone in their pocket, people interested in planning cities can get quite excited about the potential information that becomes available: where are people going; when are people going; how are people going?
Like many potential game changers though, getting access to the data is key. Companies like Google and Apple do not make their data readily available. However, Google’s recent ‘Popular Times’ feature, part of Google Maps, is actually a very useful transportation planning tool. It displays a bar chart for some commercial locations, showing which hours of the day are more popular than others.
It’s marketed as a way of helping people pick less busy times to visit their favourite restaurant or hardware store, but it’s actually a lot more powerful than that.
Shared Parking
As part of my job as a transportation consultant we are often asked to estimate the parking demand for a development. Increasingly, these developments are mixed use and focused around rapid transit (I work in Vancouver BC). Different land uses experience peak parking demand at different times of the day. For example, office buildings are busy during the day on weekdays, but very quiet during evenings and weekends. Fitness centres are especially busy right after work. There is some existing survey information out there, much of it published by the Institute of Transportation Engineers, which estimates the peak parking demand of various land uses, both as a rate, and by time of day.
By overlapping these daily parking demand profiles, the overall parking requirements for a site can be reduced. The advantages are less overall parking stalls, which means more land available for others uses.
The downside of this is that the data is limited, and getting old, and doesn’t properly differentiate between different types of communities (suburban urban, transit oriented etc).
Popular Places
This is where Popular Places comes in. In providing a bar chart for each restaurant, fitness centre or grocery store, it allows the creation of custom daily parking demand charts for a particular site. For example, if a proposed site includes a fitness centre, then the daily profiles of other fitness centres in similar locations in the same city can be reviewed, in order to get a better understanding of the likely parking demand for that use. One recent example of the potential use of this data has been in estimating the peak demand for a grocery store on a popular commuting route just outside of an urban core. The Institute of Transportation Engineer’s data suggests the peak parking demand for a grocery store is approximately 1pm in the afternoon. However, by looking specifically at grocery stores in similar locations within Metro Vancouver, we were able to determine that a more appropriate estimate of peak parking demand for this particular new store would be closer to 5pm; the after work rush.
If you wanted to know the actual peak parking demand per sq ft or sq m, you would still need to go out and survey some stores. But by using Popular Places, at least you would be sure you would capture the peak demand hours.
I Want More!
So this is very useful, but of course I want there to be more. Here’s my wish list:
- A scale on the graph so we can see the actual percentage of the peak in each hour.
- Some information concerning the estimated sample size that Google is capturing. Users have to opt in to locational services but they must have an estimate for each region as to what percentage of the population they are capturing. (There are other questions here concerning the type of sample Google has and whether it accurately reflects the population at large.)
- How are people getting there? Google has the answers to the above two questions. I’m not sure they have the answer to this one, yet. based on speed and routing, can Google estimate by what mode people are travelling?
- Can Google display data for residential towers and office buildings too? Probably not. At least not publicly, although again, it would be incredibly useful in terms of planning.
This information is valuable. Google could charge for it and, assuming it was priced correctly, people would pay for it. And it would increase the accurately of our planning substantially. Which means better sized parking lots, better sized streets and, hopefully, happier communities.
FULL STORY: Can Google’s ‘Popular Times’ Feature Change The Way We Plan?

Google's Big Mixed-Use Plans for Downtown San Jose Come Into Focus
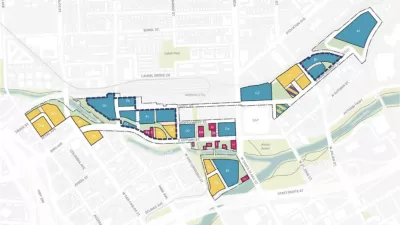
Google's plan for a mixed-use transit village at a mile-long site near the Diridon Station in San Jose has a newly released planning document available for public review.
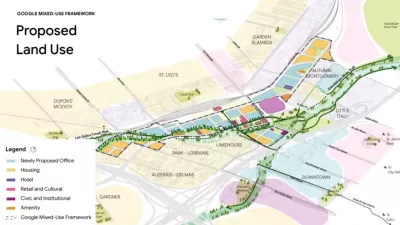
Google's San Jose Transit Village Plans Revealed
Google's plans for the Diridon Transit Village are much more clear.

How a Cartoon Enabled Meaningful Parking Reform in Ottawa
Want parking reform without tears?

Planetizen Federal Action Tracker
A weekly monitor of how Trump’s orders and actions are impacting planners and planning in America.

Congressman Proposes Bill to Rename DC Metro “Trump Train”
The Make Autorail Great Again Act would withhold federal funding to the system until the Washington Metropolitan Area Transit Authority (WMATA), rebrands as the Washington Metropolitan Authority for Greater Access (WMAGA).

DARTSpace Platform Streamlines Dallas TOD Application Process
The Dallas transit agency hopes a shorter permitting timeline will boost transit-oriented development around rail stations.

Maryland Plans Quick-Build Complete Streets Projects
The state will use low-cost interventions to improve road safety in five Maryland counties.

Downtown Los Angeles Gears Up for Growth
A new report highlights Downtown L.A.’s ongoing revival through major housing projects, adaptive reuse, hospitality growth, and preparations for global events in the years ahead.

Supreme Court Landlord Appeal Case Could Overturn Tenant Protections
A legal case claiming that COVID-era eviction moratoriums were unconstitutional could spell trouble for tenant protections.
Urban Design for Planners 1: Software Tools
This six-course series explores essential urban design concepts using open source software and equips planners with the tools they need to participate fully in the urban design process.
Planning for Universal Design
Learn the tools for implementing Universal Design in planning regulations.
Municipality of Princeton
Roanoke Valley-Alleghany Regional Commission
City of Mt Shasta
City of Camden Redevelopment Agency
City of Astoria
Transportation Research & Education Center (TREC) at Portland State University
US High Speed Rail Association
City of Camden Redevelopment Agency
Municipality of Princeton (NJ)