


The Colorado River, drinking water source for one in ten Americans, is severely impacted. A new interactive visualization illustrates just how dramatic the problem has become.
The U.S. Department of the Interior, U.S. Geological Survey, and the Bureau of Reclamation have released an interactive drought visualization tool called "Drought in the Colorado River Basin - Insights Using Open Data." The visualization tool is a component of the Department of the Interior's Open Water Data Initiative, which the departmant's website describes as "a multi-agency effort to showcase the usefulness of open data (i.e., data provided in a discoverable, sharable, and machine-readable format) by exploring the current 16-year drought and its effects on the Colorado River Basin."
The tool is essentially a story told in eleven chapters. Nitty gritty about the infrastructure built up along the watershed can be found in chapter four—"Control Structures." The role of growth and development in the Western United States is addressed in chapter eight—"Supply & Demand." Each chapter includes supporting maps, infographics, and photos, as well as links to additional reading.
FULL STORY: Drought in the Colorado River Basin

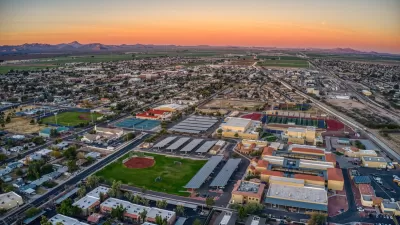
Arizona Town Looks for New Water Sources, Insists Development ‘Full Steam Ahead’
While many Southwest cities are looking for ways to conserve water and limit growth as water supplies become strained, one town is pressing ahead with rapid development.

Drinking Water More Precious Than Grass in California
Ornamental grass—the kinds of grass that line medians and roadsides but never serves for recreation—is a vanishing amenity in a drought-stricken West.

A Reckoning for Southwestern Golf Courses
Amid a growing water crisis, more cities are cracking down on ornamental uses of grass and golf course greens.

Planetizen Federal Action Tracker
A weekly monitor of how Trump’s orders and actions are impacting planners and planning in America.

Maui's Vacation Rental Debate Turns Ugly
Verbal attacks, misinformation campaigns and fistfights plague a high-stakes debate to convert thousands of vacation rentals into long-term housing.

Cuomo Is the Candidate of Both NIMBYs and Developers. What Gives?
In the New York City mayoral race, odd bedfellows align to preserve the housing status quo.

Amtrak Rolls Out New Orleans to Alabama “Mardi Gras” Train
The new service will operate morning and evening departures between Mobile and New Orleans.

The Subversive Car-Free Guide to Trump's Great American Road Trip
Car-free ways to access Chicagoland’s best tourist attractions.

San Antonio and Austin are Fusing Into one Massive Megaregion
The region spanning the two central Texas cities is growing fast, posing challenges for local infrastructure and water supplies.
Urban Design for Planners 1: Software Tools
This six-course series explores essential urban design concepts using open source software and equips planners with the tools they need to participate fully in the urban design process.
Planning for Universal Design
Learn the tools for implementing Universal Design in planning regulations.
Heyer Gruel & Associates PA
JM Goldson LLC
Custer County Colorado
City of Camden Redevelopment Agency
City of Astoria
Transportation Research & Education Center (TREC) at Portland State University
Jefferson Parish Government
Camden Redevelopment Agency
City of Claremont