


Looking for granular illustrations of the details of local economies? Look no further.
Emily Badger shares news of a new data mapping project that shows every job in the United States:
"[Economic differences] form economic identities that shape each city as much as their culture and geography do. And they're starkly — and beautifully — visible in a new visualization, made by Harvard Ph.D. student Robert Manduca, that maps nearly every job in America, one dot per job. His project, which draws on Census data reported by employers, is modeled off Dustin Cable's well-known racial dot map that mapped every person in the country."
The map uses red dots to represent manufacturing and trade; blue dots for professional services; green dots for healthcare, education, and government; and yellow dots for retail, hospitality, and other services.
Laura Bliss also picked up on the news of the new map, highlighting the benefits of dot maps and some of the job trends visible in maps of New York, San Jose, and San Francisco.
FULL STORY: Nearly every job in America, mapped in incredible detail


Friday Eye Candy: A Sorely-Needed Map of New York City Neighborhoods
Neighborhoods don't get the same official boundaries as cities, counties, states, and countries. So how do we know where one neighborhood ends and another begins?

Friday Eye Candy: The World's Subway Systems, If You Could See Them From Above
Have you ever flown over a city and imagined all the subway lines running beneath the surface?
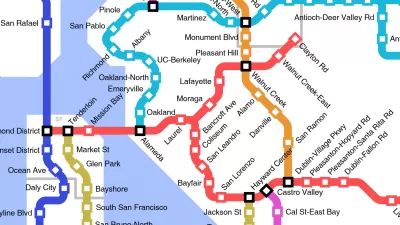
Friday Funny: Imagining Taco Bell-Oriented Rail Transit
A Reddit user created a transit map of the San Francisco Bay Area that connects Taco Bell locations, which, unlike rail public transit, have reached every corner of the region.

Planetizen Federal Action Tracker
A weekly monitor of how Trump’s orders and actions are impacting planners and planning in America.

Maui's Vacation Rental Debate Turns Ugly
Verbal attacks, misinformation campaigns and fistfights plague a high-stakes debate to convert thousands of vacation rentals into long-term housing.

San Francisco Suspends Traffic Calming Amidst Record Deaths
Citing “a challenging fiscal landscape,” the city will cease the program on the heels of 42 traffic deaths, including 24 pedestrians.

Amtrak Rolls Out New Orleans to Alabama “Mardi Gras” Train
The new service will operate morning and evening departures between Mobile and New Orleans.

The Subversive Car-Free Guide to Trump's Great American Road Trip
Car-free ways to access Chicagoland’s best tourist attractions.

San Antonio and Austin are Fusing Into one Massive Megaregion
The region spanning the two central Texas cities is growing fast, posing challenges for local infrastructure and water supplies.
Urban Design for Planners 1: Software Tools
This six-course series explores essential urban design concepts using open source software and equips planners with the tools they need to participate fully in the urban design process.
Planning for Universal Design
Learn the tools for implementing Universal Design in planning regulations.
Heyer Gruel & Associates PA
JM Goldson LLC
Custer County Colorado
City of Camden Redevelopment Agency
City of Astoria
Transportation Research & Education Center (TREC) at Portland State University
Jefferson Parish Government
Camden Redevelopment Agency
City of Claremont