


Tight on time, staff, and budget and looking for technology to help your planning effort? Explore new mobile friendly tools that can aid planners with public engagement, documentation of existing conditions, and traffic counting.


We have all been there – tight timeline, limited staff, and limited budget for your project. You want to get the job done, but aren’t sure what technology tools are out there to help you on the fly. You need tools that are easy to use, cheap, and give you instant results.
So here is the scenario: Ohio State University has been working on our transportation and parking master plan. As we are getting to the end of the planning process we realized there are data gaps and details that we want to examine further. We have only three weeks until the end of classes and therefore the end of regular transportation flow – tight timeline. I have four interns who can help me out – limited staff. Oh, and we have $250 to get it done – really limited budget.
The great news is that in the last year there have been lots of new technology tools that have come out that delivered just-in-time solutions to our planning challenge. To find these tools, I just entered key words into Google and then evaluated the apps and their suitability for our project. Below is a description of the technology tools we used in the planning process.
Challenge 1: The university is adding 3,000 new beds onto north campus, set to be complete in a year. That means an additional 3,000 students who will be crossing an important campus thoroughfare. What impact should we expect? How many pedestrians are currently crossing this road? We are thinking about moving a bus route from one street to another – will this reduce the amount of pedestrian conflict?
The first step was to talk to the Mid-Ohio Regional Planning Commission, which was able to loan us TrailMaster and EcoCounter pneumatic tubes to measure pedestrian and bicycle traffic at no cost. We combined this with the TrafficDuco mobile app. The app has options for pay per use or monthly rates; we opted for a $100 plan for one month. TrafficDuco allowed us to collect traffic counts easily and off-line, with later upload. The online system allowed me to setup the assigned traffic count times, and then interns were notified of their assigned counts. They just opened the app and went to the assigned location to collect the count data by simply tapping or swiping to collect the pedestrian, bicycle, and vehicle data. The team reported that they liked using the app and found the different sounds for the different types of traffic to be a helpful cue in ensuring they accurately recording the different modes moving through the intersection. The app support was fantastic, with the TrafficDuco team sending helpful emails specific to our observations, making sure we are using the app to its maximum potential. This allowed us to understand where people are moving through campus.
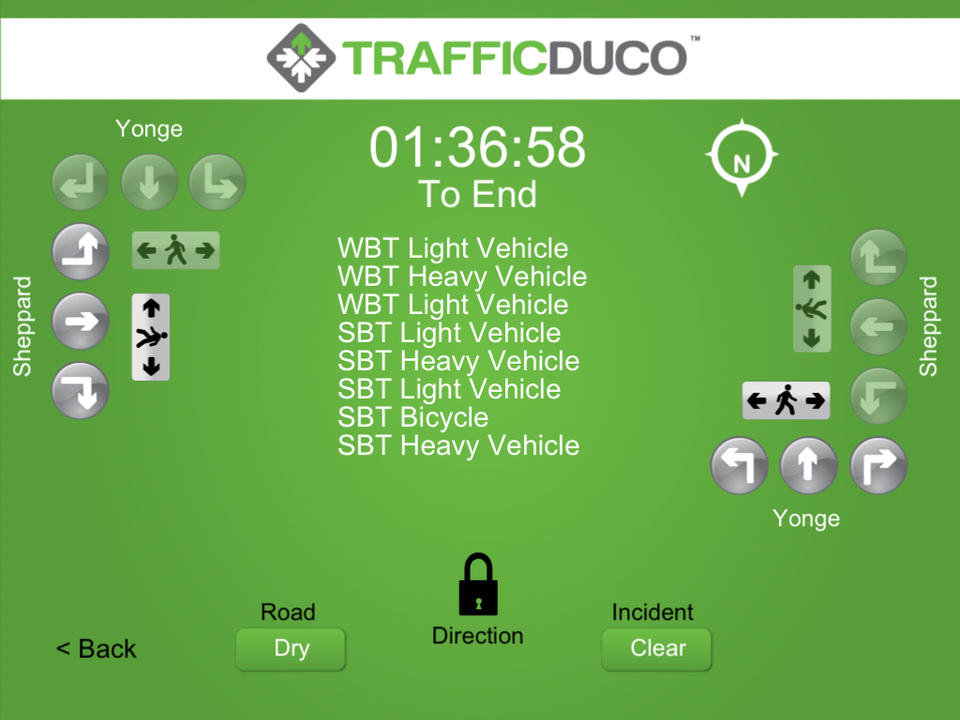 The surveyor uses simply taps buttons to record traffic as it moves through an intersection.


TrafficDuco provides easy to understand and comprehensive data for download after surveyors collect traffic counts.
Challenge 2: CoGo, a new bike sharing service in Columbus, Ohio has asked the university to expand the service onto campus. How do we know if the students, faculty, and staff want this service? How much are they willing to pay for it? How often would they use it? These questions called for a survey. We turned to QuickTapSurvey which works on Android and Apple tablets. QuickTapSurvey has a variety of price points from free to paid. The cost for our survey was $127.
In a nutshell, you input your survey questions, and then survey respondents tap their way through the answers using your tablet (or you can read the questions and tap in the responses). A great aspect of CoGo is that you can be off-line when you collect responses, so upload can happen later when you are back in the office. As a bonus, we were able to use SurveyMonkey for a web-based version of the survey that we distributed via email. The results from SurveyMonkey can easily be imported into QuickTapSurvey, combining all results. The only limitation was that the advance button was not always clear to people so we would occasionally have to explain how to go to the next question.
We were able to get more than 2,000 responses in just a week, giving us a robust set of responses to help better understand the level of interest in bike sharing.


Respondents said QuickTapSurvey was very easy, intuitive and quick to use.
Challenge 3: We want to fast track implementation and show improvements right away. What are the low hanging fruit opportunities to get out there with a paint truck and improve the pedestrian experience across campus?
OpenPlans has a free tool for collecting information, called Shareabouts. Using the Shareabouts platform, PlaceMatters created WALKScope, a web-based pedestrian evaluation tool in beta format. PlaceMatters graciously let us serve as a test user at no cost. We were able to walk streets across campus and assess the quality of the sidewalk, the quality of every intersection, and record pedestrian counts. This mobile friendly website works on Android and Apple smartphones and tablets. The team members were easily able to record their observations, including capturing pictures and describing the issues at each location. The only limitation was that you can not record observations off-line and we weren't able to edit observations after we had created them. The result is a comprehensive assessment of the pedestrian environment on campus.

WalkScope allows for easily capturing information about particular locations
These planning tools can be used in any community and offer low cost solutions to common types of information that planners collect. I hope that you'll find these tools as fun to play with as we did. Let me know if there are other mobile friendly tools that you have found helpful in your planning efforts.

Using Technology to Create Better Traffic Counts
Tired of standing on a street corner to count traffic? Technology is automating traffic counts and providing more detailed and accurate data to support planning.

Opinion: A Surprising New Foe in the War Against Pedestrians
Allowing bikes on sidewalks pits cyclists against pedestrians, an advocate argues.

Study: Americans Spending Less Time Interacting in Public Space
American pedestrians are moving faster and spending less time connecting with other people when walking down city streets.

Maui's Vacation Rental Debate Turns Ugly
Verbal attacks, misinformation campaigns and fistfights plague a high-stakes debate to convert thousands of vacation rentals into long-term housing.

Planetizen Federal Action Tracker
A weekly monitor of how Trump’s orders and actions are impacting planners and planning in America.

Chicago’s Ghost Rails
Just beneath the surface of the modern city lie the remnants of its expansive early 20th-century streetcar system.

Bend, Oregon Zoning Reforms Prioritize Small-Scale Housing
The city altered its zoning code to allow multi-family housing and eliminated parking mandates citywide.

Amtrak Cutting Jobs, Funding to High-Speed Rail
The agency plans to cut 10 percent of its workforce and has confirmed it will not fund new high-speed rail projects.

LA Denies Basic Services to Unhoused Residents
The city has repeatedly failed to respond to requests for trash pickup at encampment sites, and eliminated a program that provided mobile showers and toilets.
Urban Design for Planners 1: Software Tools
This six-course series explores essential urban design concepts using open source software and equips planners with the tools they need to participate fully in the urban design process.
Planning for Universal Design
Learn the tools for implementing Universal Design in planning regulations.
planning NEXT
Appalachian Highlands Housing Partners
Mpact (founded as Rail~Volution)
City of Camden Redevelopment Agency
City of Astoria
City of Portland
City of Laramie