


A pair of recent articles examine what it’s like to use public transit every day, year after year. One examines the mechanics of on-time delivery and service—the other, the unwritten rules of ridership.
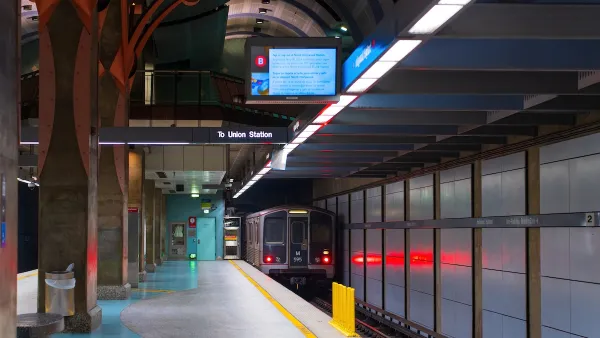
The first article, by Matt Johnson, represents a near-Herculean effort to compile a database of the author’s experiences on the Washinton D.C. Metro—the trains, their timeliness, and other anecdotal information.
“In 2013, I took 866 rides and experienced 15 delays, which means that 1.73% of my rides were delayed. In 2014, so far, I've taken 134 rides and experienced 11 delays, which means that 8.21% of my rides were delayed. That's a significant increase.”
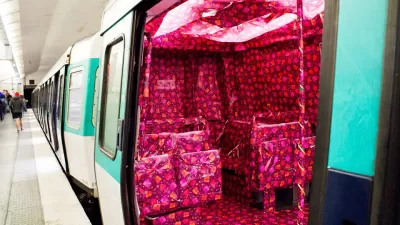
The second article, by Nicolei Gupit, describes insights gleaned from riding the Metro bus system in Los Angeles since 1998.
“I learned by heart the cadence of passing streets as I rode the buses plying Vermont: Sunset, Fountain, Santa Monica, Melrose, Beverly, First, Third, Sixth, Wilshire. I created my own map of L.A. by surveying who got on and off the bus at which stops. While I heard mostly Spanish and Armenian spoken around East Hollywood, I would hear mostly Korean, Chinese, or Tagalog when passing neighboring areas heading south and west from home.”
FULL STORY: I tracked every Metro trip I made for two years, and here's what I found

BRT Boom in U.S.
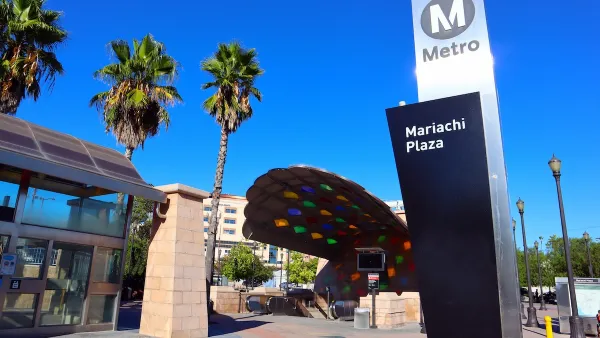
A new study says that Los Angeles, Cleveland, Las Vegas, Eugene and Pittsburgh are leading the surge with the best bus rapid transit (BRT) systems in the nation.
LA Transit Ridership Plummets Amidst ICE Raids
LA Metro’s bus and rail lines are seeing up to 15 percent lower ridership in the wake of violent immigration arrests.
High Housing Costs Driving Down Transit Ridership in LA
When neighborhoods gentrify and displace lower-income residents, transit ridership suffers, new research shows.

Maui's Vacation Rental Debate Turns Ugly
Verbal attacks, misinformation campaigns and fistfights plague a high-stakes debate to convert thousands of vacation rentals into long-term housing.

Planetizen Federal Action Tracker
A weekly monitor of how Trump’s orders and actions are impacting planners and planning in America.

Chicago’s Ghost Rails
Just beneath the surface of the modern city lie the remnants of its expansive early 20th-century streetcar system.
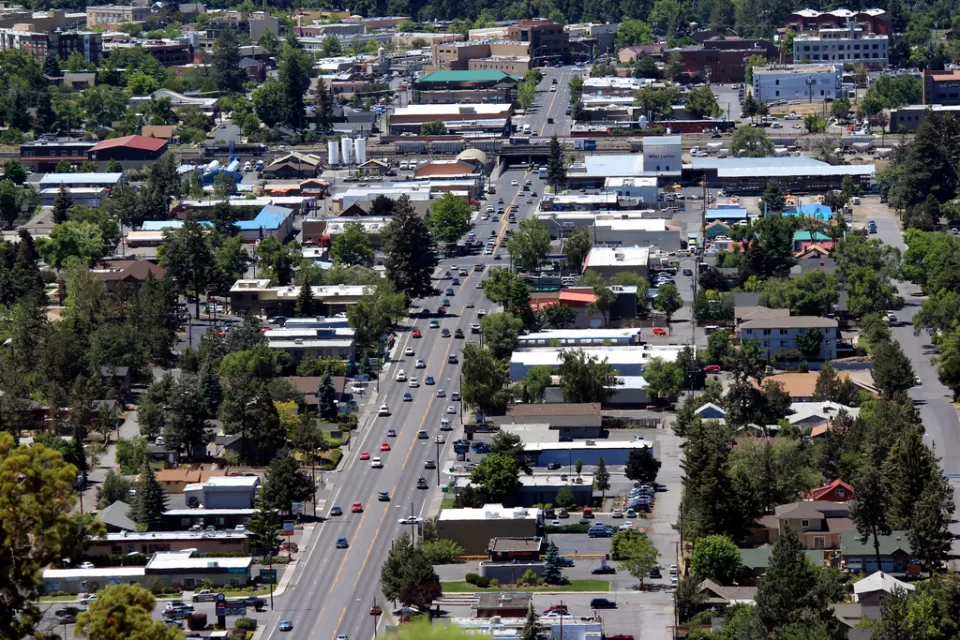
Bend, Oregon Zoning Reforms Prioritize Small-Scale Housing
The city altered its zoning code to allow multi-family housing and eliminated parking mandates citywide.

Amtrak Cutting Jobs, Funding to High-Speed Rail
The agency plans to cut 10 percent of its workforce and has confirmed it will not fund new high-speed rail projects.

LA Denies Basic Services to Unhoused Residents
The city has repeatedly failed to respond to requests for trash pickup at encampment sites, and eliminated a program that provided mobile showers and toilets.
Urban Design for Planners 1: Software Tools
This six-course series explores essential urban design concepts using open source software and equips planners with the tools they need to participate fully in the urban design process.
Planning for Universal Design
Learn the tools for implementing Universal Design in planning regulations.
planning NEXT
Appalachian Highlands Housing Partners
Mpact (founded as Rail~Volution)
City of Camden Redevelopment Agency
City of Astoria
City of Portland
City of Laramie