


Data analyst and graphics wizard Chris Walker has created a stunning interactive visualization that depicts the migration patterns between each American state in 2012.
John Metcalfe looks at Restless America, the "prismatic, arc-veined portal" that "shows the movements of the roughly 7.1 million Americans who relocated across state lines in 2012. It's based on the U.S. Census Bureau's American Community Survey, an annual tabulation of moves that just so happens to include the involuntary uprootings of prisoners and members of the military."
What drove Walker, "a data-analytics virtuoso in Mumbai who also made that clever visualization of property values in New York City," to create the graphic?
I'm really interested in migration, as I think migration patterns show that people still see opportunity and hope for better lives, and they're willing to take risks. I see migration as a form of 'creative destruction'; it renews and enriches some communities while eroding others. This process strains individual cities, but I think it's healthy for the country overall. People need to dream and be allowed to act on their dreams. I wanted to show this on a national scale.
FULL STORY: A Bewitching Look at Migration Patterns Among American States

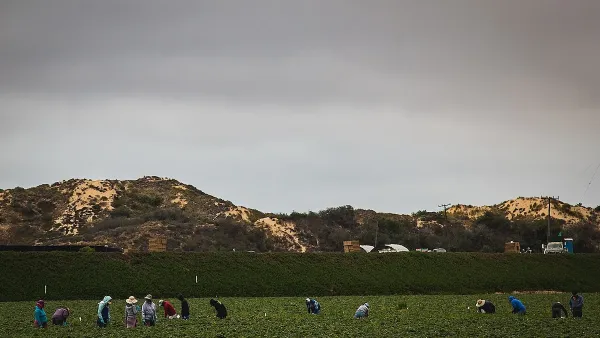
Without International Immigrants, the Rural US Population Would Be Falling 58%
Census data shows that population growth in rural areas is due in large part to international migrants.

The Five Most-Changed American Cities
A ranking of population change, home values, and jobs highlights the nation’s most dynamic and most stagnant regions.
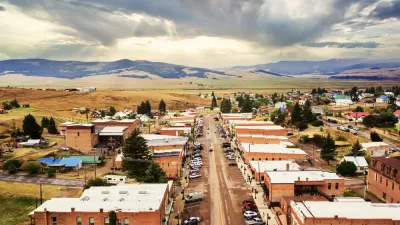
Rural Population Grew Again in 2024
Americans continued to move to smaller towns and cities, resulting in a fourth straight year of growth in rural areas.

Maui's Vacation Rental Debate Turns Ugly
Verbal attacks, misinformation campaigns and fistfights plague a high-stakes debate to convert thousands of vacation rentals into long-term housing.

Planetizen Federal Action Tracker
A weekly monitor of how Trump’s orders and actions are impacting planners and planning in America.

San Francisco Suspends Traffic Calming Amidst Record Deaths
Citing “a challenging fiscal landscape,” the city will cease the program on the heels of 42 traffic deaths, including 24 pedestrians.

Defunct Pittsburgh Power Plant to Become Residential Tower
A decommissioned steam heat plant will be redeveloped into almost 100 affordable housing units.

Trump Prompts Restructuring of Transportation Research Board in “Unprecedented Overreach”
The TRB has eliminated more than half of its committees including those focused on climate, equity, and cities.

Amtrak Rolls Out New Orleans to Alabama “Mardi Gras” Train
The new service will operate morning and evening departures between Mobile and New Orleans.
Urban Design for Planners 1: Software Tools
This six-course series explores essential urban design concepts using open source software and equips planners with the tools they need to participate fully in the urban design process.
Planning for Universal Design
Learn the tools for implementing Universal Design in planning regulations.
Heyer Gruel & Associates PA
JM Goldson LLC
Custer County Colorado
City of Camden Redevelopment Agency
City of Astoria
Transportation Research & Education Center (TREC) at Portland State University
Jefferson Parish Government
Camden Redevelopment Agency
City of Claremont