


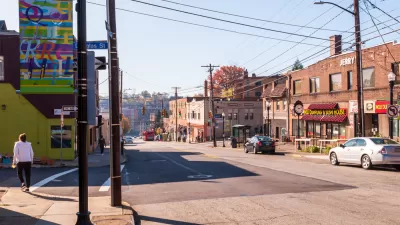
A Gallup poll asked residents of each Congressional district whether they felt safe walking alone at night in their city or area. Although city residents feared crime more than suburbs, there were some surprises.

In 2010, a Gallup poll asked 1000 Americans each day, "Do you feel safe walking alone at night in the city or area where you live?" After a year or so of polling, the Gallup organization sorted the results by congressional district. The full results are here. A few patterns I noticed:
*North vs. South. By and large, northerners felt less afraid than southerners. For example, in Florida, there was no congressional district where more than 73% of people felt safe walking alone at night. Similarly, in Georgia only one of the state's 12 congressional districts had a higher safety score. By contrast, in Wisconsin all but one of the state's eight districts yielded a safety score over 73%.
*Cities vs. suburbs. There seemed to be a moderately consistent pattern of suburbs scoring ahead of cities. For example, in Wisconsin, only 60% of the city of Milwaukee's residents felt it was safe to walk at night, as opposed to 84 percent in a neighboring suburban district. Milwaukee's "safety score" seemed to be about average for urban congressional districts. Generally, districts containing all of a city scored in the 50s and 60s- for example, the District of Columbia (62%), the First District of Colorado (Denver, 61%), the 7th of Indiana (Indianapolis, 58%), the 3rd of Kentucky (Louisville, 66%), the 7th of Maryland (Baltimore, 55%), and the 8th of Mass. (Boston, 64%).
*Outliers in both directions. Some cities achieved almost-suburban levels of perceived safety. Generally, these were cities that in fact did have lower murder rates than other major cities. For example, Seattle's safety score (72%) was almost equal to that of a neighboring suburban district (78%). Similarly, Portland was perceived as safe by 69 percent of residents, just slightly below the levels of nearby suburban districts. This perception reflects reality: in 2011, both cities had only 3 murders per 100,000 people (lower than the national rate). Nancy Pelosi's district, which includes most of the city of San Francisco clocked in at 71%- not quite as high as suburbia, but pretty close.
At the other end of the spectrum, the nation's murder capitals were indeed perceived as unsafe by their residents. In the congressional district containing New Orleans (the nation's murder capital) only 48% of residents felt comfortable walking at night, one of the lowest scores in the nation. (In fact, the district containing suburban Metairie had a safety score of only 67%, well below most northern suburbs). Similarly, the two districts containing most of the city of Detroit (the 13th and 14th districts) had safety scores of 51 and 49 percent- not surprising given that in Detroit there were 48 murders per 100,000 people in 2011, eight times as many as New York and about three times as many as Milwaukee).
*Ritzy intown neighborhoods were as safe as suburbs. In the New York city congressional districts including the Upper East and Upper West Sides, 80% of residents believed that their areas were safe to walk in- a level as high as that of Long Island's four congressional districts (whose safety scores ranged from 75 to 85 percent). New York also has an unusually low murder rate (6 per 100,000) and this fact was also reflected in the city's outer borough districts, nearly all of which beat Milwaukee's 60% score (except for a few districts in northern Manhattan and the Bronx).
On the other hand, some cities are large enough to have congressional districts dominated by troubled neighborhoods- and in those cities, the gap between the "best" and "worst" neighborhoods was reflected in safety scores. In Chicago, the "worst" district in the city's south side had a 47% score, the best urban district had a 70% socre, and the 9th District (which contaings both large chunks of the city and of its inner northern suburbs) had a 76% score.
*Aging inner suburbs were sometimes perceived as no more safe than cities. In Georgia, districts dominated by the city of Atlanta and demographically comparable DeKalb County had virtually identical safety scores (56-57%) far below that of outer suburban districts.
*On the other hand, well-off inner suburbs were perceived as comparable to outer suburbs. In Virginia, the 8th district (containing transit-oriented Arlington and Alexandria) scored as well as the 10th and 11th districts (containing sprawling Fairfax and Loudoun Counties) - all in the mid-seventies.
You may be wondering: how well does these statistics correlate with Gallup's regionwide data about people's willingness to go out at night? It is hard to say, because in most of the smaller metros listed in Gallup's "best" and "worst" list, the central cities are so small as to comprise only half a congressional district or so. The average congressional district includes 700,000 people, bigger than all six of the central cities in Gallup's "safest" metro areas. In only three of the metro areas (Denver, Austin, and Boston) was the central city big enough to dominate a congressional district, and in one of them (Austin) the central city was carved up among numerous districts.
On the other hand, the regions perceived as worst have bad reputations in their urban cores. In the region that tops Gallup's "worst" list, Memphis, the central city is mostly in one district (the 9th of Tennessee). And in that district, only 45 percent of people report a willingness to go out at night- perhaps the worst score in the United States. And in the second worst region (New Orleans) the most urban congressional district has a similarly low score, as discussed above.

Suburbs or Cities: Which Has More Crime?
A Brookings Institute report shows that the difference between crime in the suburbs and cities has drastically decreased, and argues that the current drop in crime rates weakens the correlation between ethnic groups and crime.
Another Fun Neighborhood Analysis Toy
A Trulia feature offers lots of interesting information about neighborhoods (or at least about how their residents perceive them).
Prices Pushing Home Buyers to Suburbs
Unlike previous generations that fled cities, in part over of fears of crime, today people leave many cities because they can't afford them.

Maui's Vacation Rental Debate Turns Ugly
Verbal attacks, misinformation campaigns and fistfights plague a high-stakes debate to convert thousands of vacation rentals into long-term housing.

Planetizen Federal Action Tracker
A weekly monitor of how Trump’s orders and actions are impacting planners and planning in America.

In Urban Planning, AI Prompting Could be the New Design Thinking
Creativity has long been key to great urban design. What if we see AI as our new creative partner?

King County Supportive Housing Program Offers Hope for Unhoused Residents
The county is taking a ‘Housing First’ approach that prioritizes getting people into housing, then offering wraparound supportive services.

Researchers Use AI to Get Clearer Picture of US Housing
Analysts are using artificial intelligence to supercharge their research by allowing them to comb through data faster. Though these AI tools can be error prone, they save time and housing researchers are optimistic about the future.

Making Shared Micromobility More Inclusive
Cities and shared mobility system operators can do more to include people with disabilities in planning and operations, per a new report.
Urban Design for Planners 1: Software Tools
This six-course series explores essential urban design concepts using open source software and equips planners with the tools they need to participate fully in the urban design process.
Planning for Universal Design
Learn the tools for implementing Universal Design in planning regulations.
planning NEXT
Appalachian Highlands Housing Partners
Mpact (founded as Rail~Volution)
City of Camden Redevelopment Agency
City of Astoria
City of Portland
City of Laramie