Recently I’ve been writing about skills that planners need—the findings from surveys of employers and the key role or writing in the planning skill set. Skills like writing, graphics, data analysis, and the ability to listen are obviously important. As Ethan Seltzer and Connie Ozawa’s 2002 survey found, however, several more general skills are also key. I reported these in an earlier blog and they include: working well with the public and with colleagues, being a self-starter, being able to finish work on time and on budget, and understanding public needs.
Recently I've been writing about skills that
planners need-the findings from surveys of employers and the key role or writing in the
planning skill set. Skills like writing, graphics, data analysis, and the
ability to listen are obviously important. As Ethan Seltzer and Connie Ozawa's 2002 survey found, however, several more general
skills are also key. I reported these in an earlier blog and they include: working well with the public and with colleagues,
being a self-starter, being able to finish work on time and on budget, and
understanding public needs.
Many planning schools teach students how to work well with
the public and understand their needs but what about being on time and on
budget, something increasingly important in the public sector as well as the
private?
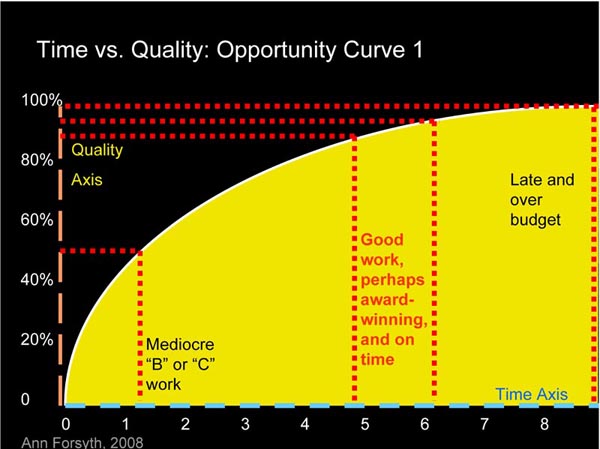
The diagram below demonstrates the challenges in doing good
work on time. This chart shows time along one axis and quality along the other. It is my interpretation of a typical project trajectory. In a bit over one unit of time a planner, or student, can get
to a 50 percent quality level. Often students can work at this level achieving
passing grades with sub-par work that is very quickly done. The work may not be
at a professional level but it can still rate a B or a C. If a student stops
here, however, they don't get to experience what it feels like to create the A or A- work
needed in an office, at least for important projects. Alternatively, there are
often no penalties for getting to a 90-95 percent level of quality (let's call this
an A quality level done in a reasonable amount of time) and then spending maybe
twice as much time to get to 96-98 percent. In a planning office this extra effort
would be a real drain-very little extra quality for a huge investment of
resources. This is called being late and over budget.

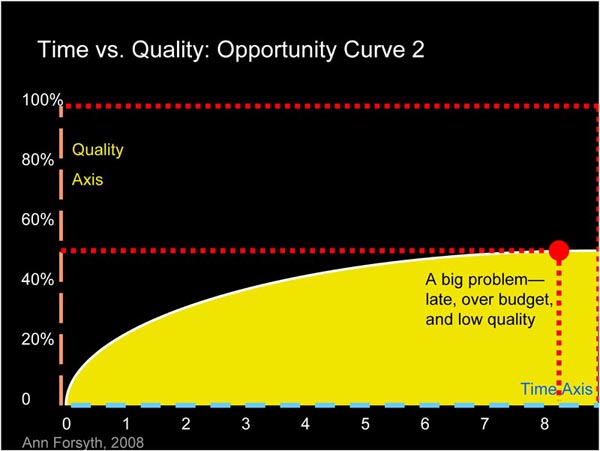
This is not, however, the worst case. Imagine the second
diagram, below. In this the quality curve flattens out much faster but a student may
still spend a huge amount of time pushing forward. Students, and
planners, may spend time on unimportant issues--such as refining some relatively unimportant diagrams or collecting data about minor issues--while not doing the overall job that is
needed. This happens when students
are not aware of what a high quality products look like and perhaps lack
direction as to how to achieve such high quality efficiently. They may lack skills in problem identification and have a hard time seeing the big picture. Some have been rewarded in the past for pure creativity without regard to whether the creativity solves an important and relevant problem. In this case, at the far right of the graph, people end out being late,
over budget, and doing work that while taking a lot of time does not demonstrate high quality in overall execution.

I try to coach students to hit the 90-95 percent quality level, in a
reasonable amount of time as demonstrated in Opportunity Curve 1. More time with
little improvement in quality just adds stress. A class experience like a
studio or workshop provides a setting for practicing hitting this middle area of the
chart. It also can provide skills for recognizing problem situations like the
one presented in Opportunity Curve 2 where quality is low in any time scenario.
While the impulse to make the world a better place is a key aspect of planning, doing this efficiently--at a high quality level and on time--is important as well.

Planetizen Federal Action Tracker
A weekly monitor of how Trump’s orders and actions are impacting planners and planning in America.

Restaurant Patios Were a Pandemic Win — Why Were They so Hard to Keep?
Social distancing requirements and changes in travel patterns prompted cities to pilot new uses for street and sidewalk space. Then it got complicated.

Map: Where Senate Republicans Want to Sell Your Public Lands
For public land advocates, the Senate Republicans’ proposal to sell millions of acres of public land in the West is “the biggest fight of their careers.”

Maui's Vacation Rental Debate Turns Ugly
Verbal attacks, misinformation campaigns and fistfights plague a high-stakes debate to convert thousands of vacation rentals into long-term housing.

San Francisco Suspends Traffic Calming Amidst Record Deaths
Citing “a challenging fiscal landscape,” the city will cease the program on the heels of 42 traffic deaths, including 24 pedestrians.

California Homeless Arrests, Citations Spike After Ruling
An investigation reveals that anti-homeless actions increased up to 500% after Grants Pass v. Johnson — even in cities claiming no policy change.
Urban Design for Planners 1: Software Tools
This six-course series explores essential urban design concepts using open source software and equips planners with the tools they need to participate fully in the urban design process.
Planning for Universal Design
Learn the tools for implementing Universal Design in planning regulations.
Heyer Gruel & Associates PA
JM Goldson LLC
Custer County Colorado
City of Camden Redevelopment Agency
City of Astoria
Transportation Research & Education Center (TREC) at Portland State University
Camden Redevelopment Agency
City of Claremont
Municipality of Princeton (NJ)


