


Analysis of global greenhouse gas emissions data points to the sectors, activities, and countries that are the biggest contributors.
Mengpin Ge and Johannes Friedrich review a series of charts from the World Resource Institute’s ClimateWatch greenhouse gas emissions data tool that show global trends.
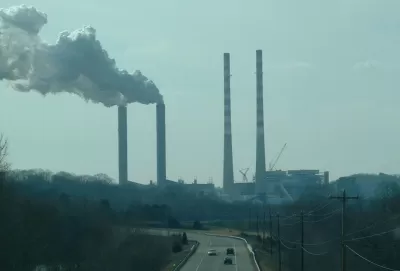
The energy sector is responsible for almost three-quarters of greenhouse gas emissions. In the energy sector, the top three end-use activities are road transportation, residential buildings, and commercial buildings.
"Since 1990, three sectors stand out as the fastest-growing sources of greenhouse gas emissions: Industrial processes grew by 174%, transportation (a subsector of energy) by 71%, and manufacturing and construction (also a subsector of energy) by 55%," note Ge and Friedrich.
They also report that ten countries emit 68 percent of global greenhouse gas emissions, with China topping the list at 26 percent. In addition, carbon dioxide makes up almost three-quarters of emissions.
Ge and Friedrich say that cutting back on greenhouse gas emissions needs to happen around the world. "The largest emissions sources, like the energy sector, are good places to start. But to fully tackle the climate crisis, we will need deep reductions across all sectors, big and small."
FULL STORY: 4 Charts Explain Greenhouse Gas Emissions by Countries and Sectors


LA’s Trees Absorb More Carbon Than Expected, But Can’t Do It Alone
A USC study finds that Los Angeles’ urban trees absorb more carbon than expected, but while they provide crucial environmental benefits, they cannot replace the urgent need for systemic emissions reductions.

Judge Declares Federal Emissions Rule ‘Arbitrary and Capricious’
Another judge already vacated the rule nationwide before the latest case was decided.

Power Demand is Surging in US
The U.S. has entered a new power paradigm according to a new energy analysis that warns of unprecedented new demands for power, largely from “new manufacturing, industrial, and data center facilities,” and the grid is not prepared for the surge.

Planetizen Federal Action Tracker
A weekly monitor of how Trump’s orders and actions are impacting planners and planning in America.

Congressman Proposes Bill to Rename DC Metro “Trump Train”
The Make Autorail Great Again Act would withhold federal funding to the system until the Washington Metropolitan Area Transit Authority (WMATA), rebrands as the Washington Metropolitan Authority for Greater Access (WMAGA).

DARTSpace Platform Streamlines Dallas TOD Application Process
The Dallas transit agency hopes a shorter permitting timeline will boost transit-oriented development around rail stations.

New Alaska Bitcoin Mine Would Burn as Much Energy as the State’s Largest Coal Plant
Fueled by “stranded” natural gas, the startup hopes to become the largest in the US, and to make Alaska an industry center.

New Jersey Duplexes Elicit Mixed Reactions
Modern, two-unit residences are proliferating in northern New Jersey communities, signaling for some a boon to the housing supply and to others a loss of historic architecture.

Renters Now Outnumber Homeowners in Over 200 US Suburbs
High housing costs in city centers and the new-found flexibility offered by remote work are pushing more renters to suburban areas.
Urban Design for Planners 1: Software Tools
This six-course series explores essential urban design concepts using open source software and equips planners with the tools they need to participate fully in the urban design process.
Planning for Universal Design
Learn the tools for implementing Universal Design in planning regulations.
Municipality of Princeton
Roanoke Valley-Alleghany Regional Commission
City of Mt Shasta
City of Camden Redevelopment Agency
City of Astoria
Transportation Research & Education Center (TREC) at Portland State University
US High Speed Rail Association
City of Camden Redevelopment Agency
Municipality of Princeton (NJ)