


What comparing 25 years of urban expansion on six continents reveals about the changing nature of the built environment.

The Vivid Maps website shares the mapping work of Reddit user mappermatt, who recently created a visualization of sprawl using data from the 2016 Atlas of Urban Expansion, created by New York University and the Lincoln Institute of Land Policy.
The map traces the "urban extents" of 66 cities over a period of 25 years. The cities are shown at the same scale to allow for easy comparison, but also going beyond administrative boundaries. Instead, the maps represent the "contiguous built-up urbanized area of each city’s respective metropolitan region," according to the article.
The Vivid Maps article also provides insight into what the maps make apparent, such as the kinds of growth in some cities, the relative lack of growth in others, and what the map reveals about the changing density of these cities. The map's revelations about density, according to the article, reveal some of its most interesting takeaways.
FULL STORY: 25 Years of Urban Growth and Density Change in 66 Global Cities


Maps: How Much of Your City is Parking?
The percentage of land dedicated to parking in the central districts of major U.S. cities ranges from 4 percent to as much as 42 percent.
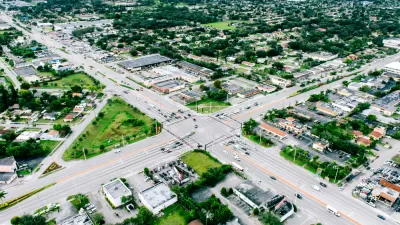
Florida Law Would Change the Definition of ‘Sprawl’
One quick way to build sprawl.

YIMBYs and Environmentalists Team Up at Last
The politics of development in California achieved another significant milestone recently, when a YIMBY organization and an environmental advocacy organization collaborated on new land use legislation to be considered by the State Legislature.

Montreal Mall to Become 6,000 Housing Units
Place Versailles will be transformed into a mixed-use complex over the next 25 years.

Planetizen Federal Action Tracker
A weekly monitor of how Trump’s orders and actions are impacting planners and planning in America.

DARTSpace Platform Streamlines Dallas TOD Application Process
The Dallas transit agency hopes a shorter permitting timeline will boost transit-oriented development around rail stations.

Study: 4% of Truckers Lack a Valid Commercial License
Over 56% of inspected trucks had other violations.

Chicago Judge Orders Thousands of Accessible Ped Signals
Only 3% of the city's crossing signals are currently accessible to blind pedestrians.

Philadelphia Swaps Car Lanes for Bikeways in Unanimous Vote
The project will transform one of the handful of streets responsible for 80% of the city’s major crashes.
Urban Design for Planners 1: Software Tools
This six-course series explores essential urban design concepts using open source software and equips planners with the tools they need to participate fully in the urban design process.
Planning for Universal Design
Learn the tools for implementing Universal Design in planning regulations.
City of Mt Shasta
City of Camden Redevelopment Agency
City of Astoria
Transportation Research & Education Center (TREC) at Portland State University
US High Speed Rail Association
City of Camden Redevelopment Agency
Municipality of Princeton (NJ)