


The effects of one of the Trump Administration's most aggressive policy objectives, a crackdown on illegal immigration, have differed by region.

A Kristen Bialik post for the Pew Research Center maps out the effects of the Trump Administration's immigration policies and enforcement:
After years of decline, the number of arrests made by U.S. Immigration and Customs Enforcement (ICE) climbed to a three-year high in fiscal 2017, according to data from the agency. The biggest percentage increases were in Florida, northern Texas and Oklahoma.
The article explains more of the trends in immigration arrests since Trump has taken office (e.g., though the number of arrests increased from 2016, the number of arrests was still higher in 2009) as well as the focus of ICE's activities around the country. The post also presents all of this new data in several maps, which illustrate the scope of the Trump Administration's enforcement of immigration law.
Here's how the post sums up the geographic trends apparent in the data:
The overall number of immigration arrests made by ICE in 2017 varied around the U.S., and the most arrests did not always occur in areas close to the U.S.-Mexico border or in places with the largest unauthorized immigrant populations (such as the New York and Los Angeles metro areas).
ICE arrests were highest in the agency’s Dallas area (16,520), which also saw the largest increase in absolute numbers between 2016 and 2017 (up 6,886). The Houston and Atlanta areas had the second- and third-highest totals in 2017 (each around 13,500), followed by the Chicago, San Antonio and Los Angeles areas (each with roughly 8,500 arrests).
Hat tip to Tanvi Misra for sharing the news of the arrest data and lending additional perspective to the new immigration arrest data.
FULL STORY: ICE arrests went up in 2017, with biggest increases in Florida, northern Texas, Oklahoma

LA Transit Ridership Plummets Amidst ICE Raids
LA Metro’s bus and rail lines are seeing up to 15 percent lower ridership in the wake of violent immigration arrests.

Duffy Threatens to Cut DOT Funds to “Sanctuary Cities”
“Follow the law or forfeit the funding” says US Secretary of Transportation.
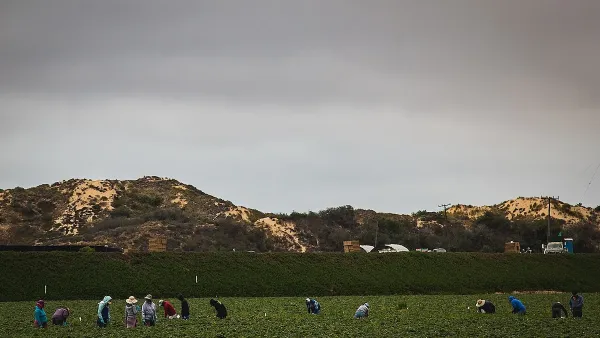
Without International Immigrants, the Rural US Population Would Be Falling 58%
Census data shows that population growth in rural areas is due in large part to international migrants.

Maui's Vacation Rental Debate Turns Ugly
Verbal attacks, misinformation campaigns and fistfights plague a high-stakes debate to convert thousands of vacation rentals into long-term housing.

Planetizen Federal Action Tracker
A weekly monitor of how Trump’s orders and actions are impacting planners and planning in America.

San Francisco Suspends Traffic Calming Amidst Record Deaths
Citing “a challenging fiscal landscape,” the city will cease the program on the heels of 42 traffic deaths, including 24 pedestrians.

Defunct Pittsburgh Power Plant to Become Residential Tower
A decommissioned steam heat plant will be redeveloped into almost 100 affordable housing units.

Trump Prompts Restructuring of Transportation Research Board in “Unprecedented Overreach”
The TRB has eliminated more than half of its committees including those focused on climate, equity, and cities.

Amtrak Rolls Out New Orleans to Alabama “Mardi Gras” Train
The new service will operate morning and evening departures between Mobile and New Orleans.
Urban Design for Planners 1: Software Tools
This six-course series explores essential urban design concepts using open source software and equips planners with the tools they need to participate fully in the urban design process.
Planning for Universal Design
Learn the tools for implementing Universal Design in planning regulations.
Heyer Gruel & Associates PA
JM Goldson LLC
Custer County Colorado
City of Camden Redevelopment Agency
City of Astoria
Transportation Research & Education Center (TREC) at Portland State University
Jefferson Parish Government
Camden Redevelopment Agency
City of Claremont