"A German university student has developed a fun new tool for visualizing public transit in a more system-oriented way," according to a post by Sam Sturgis.



According to Sam Sturgis's explanation, Transit Visualization Client, or TRAVIC, "takes public data from 249 transportation networks, across five continents, and puts them onto one, animated map." The animation runs on the schedules of the transit systems, so it's not displaying real time conditions. TRAVIC does, however, provide a broad, birds-eye view of the circulatory system of these cities, while also inviting comparison between the characteristics of transit systems around the world.
Sturgis provides analysis of the Washington, D.C. animation as well as sharing the discussion TRAVIC prompted in the city of Melbourne, Australia, as written in a separate article by Liam Mannix. Sturgis also provides GIFs of the animation for the cities of Sao Paulo, Brazil; Mexico City, Mexico; London, U.K.; Manhattan, New York; and Frankfurt, Germany.
Read the full story: What You Can Learn Watching the Movements of an Entire Public Transportation System

Visualizing the Spread of the OpenStreetMap Project
OpenStreetMap has released an animated map to illustrate the impressive growth of the project over the first ten years of its existence.
How Images Shape our Understanding of Places
An article by Ben Campkin, Marina Mogilevich, and Rebecca Ross examines how images shape ideas about cities—from "John Snow’s Cholera map to Le Corbusier's plan for a contemporary city and Moose's 'clean graffiti.'"

40 Visualizations of America and its Relationship with Food
A new post by Vox includes 40 maps, charts, and graphs explain that where and how food works in America.

Planetizen Federal Action Tracker
A weekly monitor of how Trump’s orders and actions are impacting planners and planning in America.

Amtrak, CN end decades-long dispute with eight-year agreement
The new operating agreement establishes an updated framework for the companies to work together, including processes to resolve disputes.
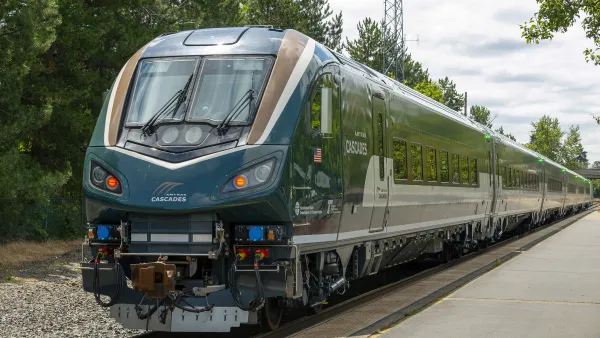
Northwest rail fans eager for Sept. 30 debut of Amtrak’s Airo fleet
Get ready for that new train smell and more seats. But they won’t go faster or run more frequently on the Cascades route in Washington and Oregon.

Brightline Florida files for bankruptcy
The transit company is over $5 billion in debt.

St. Louis Metro to test if single-car trains can reduce operating costs, maintain rider satisfaction
The pilot program will run from October to spring 2027, and begin with one single-car train operating on Metrolink’s Red and Blue lines.

Pennsylvania is building data centers in abandoned mines
Housing data centers in mines provides an alternative to destroying local forests and may spare residents from data centers’ noise and air pollution.

FREE Course: Walkable City 1: Why Walkability?
After describing his path towards focusing on walkability as the essence of good planning, Jeff Speck marches through his five principal reasons for making more walkable places.
Reinventing Malls: Planning Alchemy—Turning Gray Fields Into Gold
The course focuses on the opportunities and imperatives that shape reinvention of mall sites.

City of Thousand Oaks
City of Wisconsin Rapids
Harvard University Graduate School of Design
The Architects Foundation
University of Cincinnati Online
The Pocatello Development Authority
The Urban Renewal Agency of the City of Pocatello