Experts have opined that up to 60 percent of residents are inclined to want to bike, but concerned about the safety of their route. Working from this premise, the city of Austin has developed a novel bike map keyed to the comfort of each street.


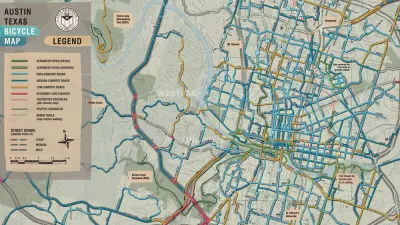
Sarah Goodyear describes the experience-based bike maps developed by Nathan Wilkes, a project engineer at the Austin public works department, and his colleagues with the city of Austin.
"The city’s map prioritizes rider comfort in its symbology. 'We tried to make it real intuitive,' says Wilkes, who has been refining the concept for several years now." Colors are used to symbolize one of five comfort levels. "The result is a map that shows at a glance where the riding is easy and where it’s more challenging. Because the colors are parallel to those used by traffic lights (with the addition of that peaceful-looking blue) they make a deep kind of sense to our eyes and brains."
"One of the things Wilkes and his colleagues are trying to achieve with the map is to show just what is available that meets the very highest comfort level. 'We want people to see, hey, look at all these places you can go even with your kids.' At the same time, the map is helpful to planners because it shows comfort gaps in the network so clearly – spaces where the green and blue bits need to be filled in."
Read the full story: Bike Maps That Give Riders the Info They Actually Need


Airbnb launches $250 million 'last-dollar financing' housing accelerator, makes first investment in Austin
The company will put $6.4 million towards affordable housing development in Texas’ capital.
Large projects near Austin's light rail must include affordable housing
Elsewhere in the city, developers can pay into a city bank account for affordable housing rather than providing the required affordable units within their projects.
The new Texas law declawing NIMBYs
State lawmakers gutted an old Jim Crow-era state law that required a city council supermajority to approve a new housing development if neighbors petitioned the proposal.

Planetizen Federal Action Tracker
A weekly monitor of how Trump’s orders and actions are impacting planners and planning in America.

The state-sanctioned urbicide of Austin
People don’t kill cities. Freeways do.

Colorado’s Largest Data Center Could Rise Next to Homes — Without a Public Hearing
The proposed campus would consume 11 times the power of Denver International Airport; as it has across the country, opposition mounts.

Data centers are consuming nearly 25% of Oregon’s power
The state has 111 data centers, with 32 more either planned or under construction.

A third of Texas cities must update their zoning codes to comply with new housing law
Texas municipalities are now required to allow manufactured housing in at least one residential zoning district.

Nation's most wind-powered state turns to coal as data centers increase energy demand
For the first time in decades, Iowa has increased its generation of coal power.

FREE Course: Walkable City 1: Why Walkability?
After describing his path towards focusing on walkability as the essence of good planning, Jeff Speck marches through his five principal reasons for making more walkable places.
Reinventing Malls: Planning Alchemy—Turning Gray Fields Into Gold
The course focuses on the opportunities and imperatives that shape reinvention of mall sites.

Greater Baltimore Committee
Eagle County Government
Harvard University Graduate School of Design
The Architects Foundation
University of Cincinnati Online
The Pocatello Development Authority
The Urban Renewal Agency of the City of Pocatello
Journal of the American Planning Association