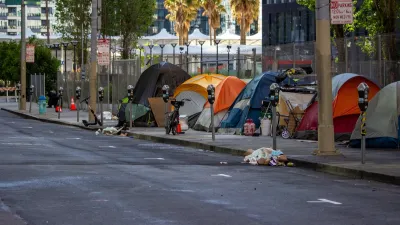
Each year, cities across the nation undertake a massive effort to physically count their unhoused residents.

An audio segment from KQED by Sydney Johnson describes how San Francisco city workers and volunteers conduct the annual Point-in-Time (PIT) Count, which aims to accurately count the number of people living unhoused in the city.
Workers in the story describe the challenges of identifying people who live in vehicles and other hard-to-find areas, as well as people who are semi-housed or live on and off with friends or family. According to the piece, getting an accurate count is particularly difficult in many parts of California because a larger percentage of the state’s homeless population is unsheltered.
The Point-in-Time Count is an annual nationwide effort conducted each January. The Department of Housing and Urban Development (HUD) gathers the data into a comprehensive report. In 2023, the report revealed that homelessness increased by 12 percent.
FULL STORY: How San Francisco Counts Unhoused Residents

Montreal Mall to Become 6,000 Housing Units
Place Versailles will be transformed into a mixed-use complex over the next 25 years.

Planetizen Federal Action Tracker
A weekly monitor of how Trump’s orders and actions are impacting planners and planning in America.

DARTSpace Platform Streamlines Dallas TOD Application Process
The Dallas transit agency hopes a shorter permitting timeline will boost transit-oriented development around rail stations.

Interactive Map Reveals America's “Shade Deserts”
Launched by UCLA and American Forests to combat heat-related deaths, the tool maps the shade infrastructure for over 360 U.S. cities.

Bicycles and Books — In Sacramento, Libraries Now Offer Both
Adult library card holders can check out e-bikes and e-trikes for up to one week.

Colorado Landfills Emit as Much Pollution as 1M Cars
Landfills are the third-largest source of methane pollution in Colorado, after agriculture and fossil fuel extraction.
Urban Design for Planners 1: Software Tools
This six-course series explores essential urban design concepts using open source software and equips planners with the tools they need to participate fully in the urban design process.
Planning for Universal Design
Learn the tools for implementing Universal Design in planning regulations.
City of Mt Shasta
City of Camden Redevelopment Agency
City of Astoria
Transportation Research & Education Center (TREC) at Portland State University
US High Speed Rail Association
City of Camden Redevelopment Agency
Municipality of Princeton (NJ)


