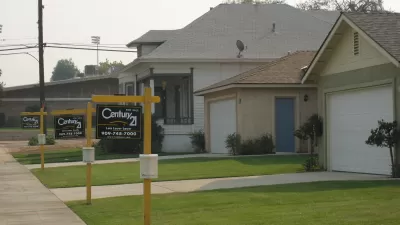
The nationwide house price-to-rent ratio has hit its highest level since 1975.

William R. Emmons, an economist at the Federal Reserve Bank of St. Louis, shares details of a key metric for explaining the current state of the housing market.
"The nationwide house price-to-rent ratio, a widely used measure of housing valuation that is analogous to the price-to-dividend ratio for the stock market, is at its highest level since at least 1975," writes Emmons.
"Rapid house price appreciation since last May, combined with a slowdown in rent growth, resulted in a surge in this ratio," explains Emmons for the combination of forces at work in the housing markets. "By February 2021, the national house price-to-rent ratio had surpassed the previous peak reached in January 2006; in March 2021, the ratio was 1% higher than its level at the peak of the housing bubble."
What does that all mean? According to Emmons, the imbalance in the house price-to-rent ratio suggests that the average house is selling for "quite a bit more" than its "fair value."
The article includes more details on the methodology for calculating the house price-to-rent ratio, an explanation of the "fair value" of a house, and a note about the difference between the current housing market and the conditions that led to the subprime meltdown and Great Recession of 2007 to 2009.
FULL STORY: House Prices Surpass Housing-Bubble Peak on One Key Measure of Value

Planetizen Federal Action Tracker
A weekly monitor of how Trump’s orders and actions are impacting planners and planning in America.

Congressman Proposes Bill to Rename DC Metro “Trump Train”
The Make Autorail Great Again Act would withhold federal funding to the system until the Washington Metropolitan Area Transit Authority (WMATA), rebrands as the Washington Metropolitan Authority for Greater Access (WMAGA).

DARTSpace Platform Streamlines Dallas TOD Application Process
The Dallas transit agency hopes a shorter permitting timeline will boost transit-oriented development around rail stations.

Renters Now Outnumber Homeowners in Over 200 US Suburbs
High housing costs in city centers and the new-found flexibility offered by remote work are pushing more renters to suburban areas.

The Tiny, Adorable $7,000 Car Turning Japan Onto EVs
The single seat Mibot charges from a regular plug as quickly as an iPad, and is about half the price of an average EV.

Supreme Court Ruling in Pipeline Case Guts Federal Environmental Law
The decision limits the scope of a federal law that mandates extensive environmental impact reviews of energy, infrastructure, and transportation projects.
Urban Design for Planners 1: Software Tools
This six-course series explores essential urban design concepts using open source software and equips planners with the tools they need to participate fully in the urban design process.
Planning for Universal Design
Learn the tools for implementing Universal Design in planning regulations.
Roanoke Valley-Alleghany Regional Commission
City of Mt Shasta
City of Camden Redevelopment Agency
City of Astoria
Transportation Research & Education Center (TREC) at Portland State University
US High Speed Rail Association
City of Camden Redevelopment Agency
Municipality of Princeton (NJ)


