


The National Highway Safety Administration released traffic safety data finding a huge spike in fatalities since the outset of the pandemic, but didn't mention the role of street design in traffic fatalities.
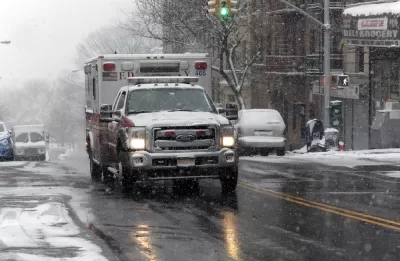
"The rate of roadway fatalities skyrocketed to 1.42 deaths per 100 million vehicle miles traveled in the second quarter of 2020, according to the National Highway Safety Administration’s just-released report," reports Kea Wilson.
The report makes officials news that has been apparent since the beginning of the pandemic: that drivers are more reckless and dangerous since stay-at-home orders and social distancing emptied roads of cars around the country.
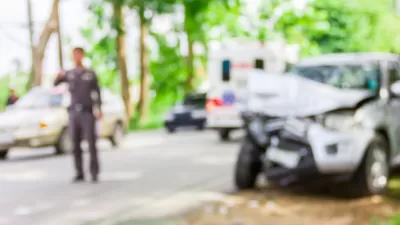
The 1.42 deaths per 100 million vehicles miles traveled represents a 32 percent increase over the 1.08 deaths per 100 million vehicle miles traveled reported for the same period last year.
"With so many fewer cars on the road, the raw number of deadly crashes did decrease during the height of quarantine orders, but not by very much," writes Wilson. "NHTSA reports that 8,870 people lost their lives on U.S. roadways between April and June of this year — just a 3.3-percent decrease over the same period last year, despite declines of driving of as much as 94 percent in many areas of the country."
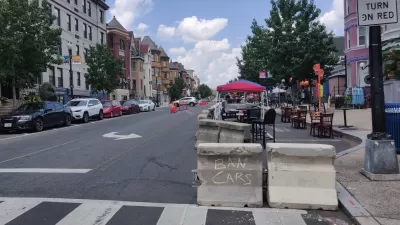
In an exclusive interview with Reuters, a spokesperson for the NHSTA blamed drivers for risky behavior, but Wilson expresses dismay that "the federal agency blamed the bloodshed on everything but bad road design."
FULL STORY: Road Fatality Rates Reach Highest Level in 15 Years

Traffic Fatalities Set Records as Pandemic-Era Road Carnage Shows No Signs of Stopping
An estimated 42,915 people died in automobile crashes in 2021, according to recent federal data. The increasing fatalities continue a trend that began with the outset of the pandemic.
Experts Fear a Permanent 'Arousal Breakout' on U.S. Roadways
The reckless and dangerous driving that has been a hallmark of the Covid-19 pandemic could become a more common, permanent feature of life in the United States.
The Most Complete Map of U.S. Pedestrian Risk Yet
New research published by the Journal of Transport and Land Use analyzes tens of thousands of pedestrian fatalities over 16 years in the United States.

Montreal Mall to Become 6,000 Housing Units
Place Versailles will be transformed into a mixed-use complex over the next 25 years.

Planetizen Federal Action Tracker
A weekly monitor of how Trump’s orders and actions are impacting planners and planning in America.

DARTSpace Platform Streamlines Dallas TOD Application Process
The Dallas transit agency hopes a shorter permitting timeline will boost transit-oriented development around rail stations.

Study: 4% of Truckers Lack a Valid Commercial License
Over 56% of inspected trucks had other violations.

Chicago Judge Orders Thousands of Accessible Ped Signals
Only 3% of the city's crossing signals are currently accessible to blind pedestrians.

Philadelphia Swaps Car Lanes for Bikeways in Unanimous Vote
The project will transform one of the handful of streets responsible for 80% of the city’s major crashes.
Urban Design for Planners 1: Software Tools
This six-course series explores essential urban design concepts using open source software and equips planners with the tools they need to participate fully in the urban design process.
Planning for Universal Design
Learn the tools for implementing Universal Design in planning regulations.
City of Mt Shasta
City of Camden Redevelopment Agency
City of Astoria
Transportation Research & Education Center (TREC) at Portland State University
US High Speed Rail Association
City of Camden Redevelopment Agency
Municipality of Princeton (NJ)