


City Observatory research shows that urban regions where residents drive less and rely more on other travel modes have more independent restaurants and more varied dining options. Bon appetit for walking, bicycling and public transit.
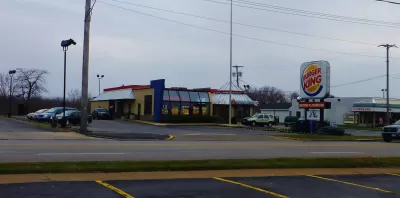
City Observatory recently used data compiled by Yelp to compute the market share of chains in the nation’s largest metro areas. Overall, about a quarter of all restaurants are part of a chain, but that fraction varies widely across metro areas. We think that a high market share of independent restaurants is likely a good indicator of a thriving and diverse food scene, and is a strong amenity for many metro areas.
We’re not sure what the driving factors are that contribute to the more robust health of independent restaurants relative to chains in some metros, but we had a hunch. Metro areas vary widely in their level of car dependence, indicated by the average number of miles driven per person per day. In the typical large metro area, that figure is about 25 miles per person per day, but is far lower in compact, transit-served metros, and noticeably higher in sprawling, car-dependent metros.
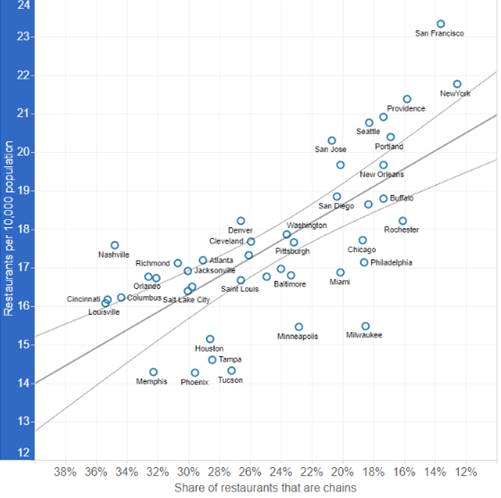
So we took U.S. DOT estimates of the number of miles driven per person per day in large metro areas and compared it with Yelp’s data on the market share of chain restaurants in those same metros.

The data show a strong positive relationship between miles driven and chain restaurant market share. Metros where people drive more have a higher fraction of chain restaurants. For example, New York, Portland, and New Orleans all have a very low share of chain restaurants (less than 20 percent), and also have very low rates of driving per capita. Places where people drive a lot (Atlanta, Charlotte and Orlando) tend to have very high proportions of chain restaurants (more than 30 percent). Overall, each additional mile driven per day is associated with an 0.6 percentage point increase in the share of chain restaurants in a metropolitan area.
We can conjecture why this might be. If people travel more by car, then it may be more important for restaurants to be visible and accessible by car, whether located along highways or in strip malls. National brands and advertising may be relatively more important to gaining consumer awareness than they are in cities where people drive less. If people spend less time driving in cities because they are more compact, or more accessible by transit, biking and walking, that may provide more niches for smaller scale independent restaurants, compared to formula-driven chains. Often times traffic levels on streets and arterials are location factors for national chains: unless a site has so many thousands of cars passing per day, they won’t consider opening a restaurant. That kind of rationale may lead to more chain restaurants in places where people drive more.
This could also be more evidence for our Green Dividend: People who drive less spend less money on cars and gasoline, and have more money to spend on food, including supporting their local independent restaurants.
Regardless of the exact reasons, the strength of this finding is striking. It suggests that if you want to have more consumer choice and more independent entrepreneurship in your local restaurant scene, you want to have a less car-dependent transportation system. Our auto dependency may be on of the things fueling the banal sameness typically associated with chains.
FULL STORY: How Driving Ruins Local Flavor


The Cost of Driving Increasingly Out of Reach in the U.S.
New research stresses the importance of socioeconomic differences in U.S. transportation trends.
The Right to Mobility
As we consider how to decarbonize transportation, preserving mobility, especially for lower- and middle-income people, must be a priority.
The United Nations Calls on U.S. Planners to Break Land Use, Transportation Status Quo
“We are on a highway to climate hell with our foot on the accelerator.”

Planetizen Federal Action Tracker
A weekly monitor of how Trump’s orders and actions are impacting planners and planning in America.

Chicago’s Ghost Rails
Just beneath the surface of the modern city lie the remnants of its expansive early 20th-century streetcar system.
San Antonio and Austin are Fusing Into one Massive Megaregion
The region spanning the two central Texas cities is growing fast, posing challenges for local infrastructure and water supplies.

Since Zion's Shuttles Went Electric “The Smog is Gone”
Visitors to Zion National Park can enjoy the canyon via the nation’s first fully electric park shuttle system.

Trump Distributing DOT Safety Funds at 1/10 Rate of Biden
Funds for Safe Streets and other transportation safety and equity programs are being held up by administrative reviews and conflicts with the Trump administration’s priorities.

German Cities Subsidize Taxis for Women Amid Wave of Violence
Free or low-cost taxi rides can help women navigate cities more safely, but critics say the programs don't address the root causes of violence against women.
Urban Design for Planners 1: Software Tools
This six-course series explores essential urban design concepts using open source software and equips planners with the tools they need to participate fully in the urban design process.
Planning for Universal Design
Learn the tools for implementing Universal Design in planning regulations.
planning NEXT
Appalachian Highlands Housing Partners
Mpact (founded as Rail~Volution)
City of Camden Redevelopment Agency
City of Astoria
City of Portland
City of Laramie