


Ridership recovery is an uphill battle for transit agencies across the nation, but some metro areas have made progress.
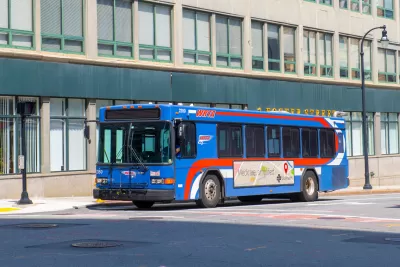
Public transit ridership is still lagging behind pre-pandemic levels in most major U.S. metro areas, according to the American Public Transportation Association’s third-quarter public transportation ridership report. Axios staffers Alex Fitzpatrick and Kavya Beheraj compared the data to 2019 numbers and highlighted key trends.
At a national level, ridership currently stands at 77 percent of pre-pandemic levels. Drilling down to the state level, just nine of around 100 U.S. metro areas with more than 500,000 people had September 2023 public transit ridership at or above 100 percent of September 2019; of those nine, Poughkeepsie, New York (150.3 percent); Worcester, Massachusetts (141percent) and Youngstown, Ohio (130 percent) had the highest.
Fitzpatrick and Beheraj attribute a recent rise in ridership rates for some of the countries biggest transit systems to employers requiring workers to return to the office. New York subway ridership is up 16 percent, Chicago’s L is up 14 percent, and San Francisco’s Muni Metro light rail network has risen 43 percent.
In addition to return to the office, the authors say cities have been experimenting with a variety of tactics to boost ridership, including reduced or waived fares, new and adjusted routes based on people’s post-pandemic travel patterns, and investments in infrastructure.
FULL STORY: Where public transit is recovering — and where it's not

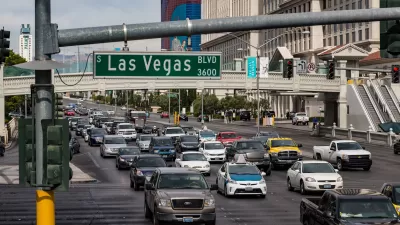
In Las Vegas, Ridesharing and Transit Complement and Compete
A look at transportation trends in Las Vegas suggests a surprising relationship between ridesharing and transit.

Chicago Transit Recovery Trails Behind Other Major US Cities
Sluggish ridership rates and staffing shortages are dampening recovery. Looming budget gaps could make things even worse.
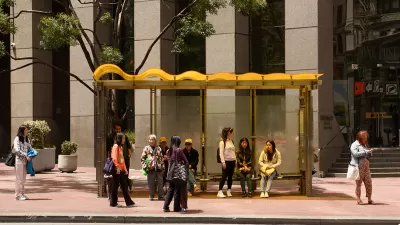
The Demographics of U.S. Transit Ridership
New research from the Pew Research Center provides insight into the people relying on public transit.

Maui's Vacation Rental Debate Turns Ugly
Verbal attacks, misinformation campaigns and fistfights plague a high-stakes debate to convert thousands of vacation rentals into long-term housing.

Planetizen Federal Action Tracker
A weekly monitor of how Trump’s orders and actions are impacting planners and planning in America.

In Urban Planning, AI Prompting Could be the New Design Thinking
Creativity has long been key to great urban design. What if we see AI as our new creative partner?

The Vast Potential of the Right-of-Way
One writer argues that the space between two building faces is the most important element of the built environment.

Florida Seniors Face Rising Homelessness Risk
High housing costs are pushing more seniors, many of them on a fixed income, into homelessness.

Massachusetts Budget Helps Close MBTA Budget Gap
The budget signed by Gov. Maura Healey includes $470 million in MBTA funding for the next fiscal year.
Urban Design for Planners 1: Software Tools
This six-course series explores essential urban design concepts using open source software and equips planners with the tools they need to participate fully in the urban design process.
Planning for Universal Design
Learn the tools for implementing Universal Design in planning regulations.
Gallatin County Department of Planning & Community Development
Heyer Gruel & Associates PA
JM Goldson LLC
City of Camden Redevelopment Agency
City of Astoria
Transportation Research & Education Center (TREC) at Portland State University
Jefferson Parish Government
Camden Redevelopment Agency
City of Claremont