


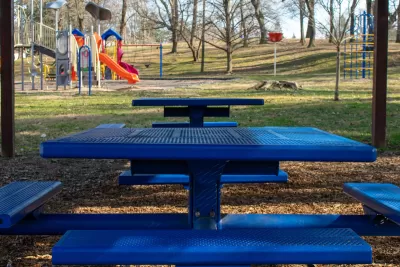
Mapping playgrounds and their conditions can reveal how childhood play opportunities are inequitably distributed within cities.
A data-driven tool maps ‘playspace inequity’ in Philadelphia with the goal of highlighting the neighborhoods where young children lack access to playgrounds, writes Amanda Loudin in Next City. “While the numbers are specific to Philadelphia, KABOOM! provides similar data sets to other cities interested in learning about and addressing playspace inequity.”
Like other issues, understanding playspace inequity starts with data. “Needing an accurate method for data gathering on playspace locations, KABOOM! created what it calls the Playspace Inequity Prioritization Index (PIPI), made up of 21 data points for census tracts within the United States.” The index accounts for the condition of playgrounds as wel as their locations.
In Philadelphia, the scale indicates that “nearly one-third of the city’s census tracts and 40% of early childcare providers do not have access to a playspace.”
As Loudin explains, “Looking ahead, KABOOM! plans to not just identify where new playspaces should go in cities like Philadelphia, but then measure their usage after. Ultimately, KABOOM!’s multi-pronged approach to closing the playspace inequity gap will have lasting impacts on the communities it serves.”
FULL STORY: New Data Tool Shows Cities Where to Build Their Next Playground

The Battle for Playgrounds
New York City parents are unhappy that fitness enthusiasts are turning to playgrounds for their workouts.

Should Risky Playgrounds Make a Comeback?
From the mid-19th century to the early 1980s, playgrounds were designed public spaces that would likely horrify parents today. Swiss urban planner Gabriela Burkhalter has studied how these public spaces have evolved over the years.
Playgrounds Pop Up in New York
Neighborhoods in New York City have built temporary "pop-up" playgrounds in an effort to encourage more physical activity among children.

Maui's Vacation Rental Debate Turns Ugly
Verbal attacks, misinformation campaigns and fistfights plague a high-stakes debate to convert thousands of vacation rentals into long-term housing.

Planetizen Federal Action Tracker
A weekly monitor of how Trump’s orders and actions are impacting planners and planning in America.

San Francisco Suspends Traffic Calming Amidst Record Deaths
Citing “a challenging fiscal landscape,” the city will cease the program on the heels of 42 traffic deaths, including 24 pedestrians.

Defunct Pittsburgh Power Plant to Become Residential Tower
A decommissioned steam heat plant will be redeveloped into almost 100 affordable housing units.

Trump Prompts Restructuring of Transportation Research Board in “Unprecedented Overreach”
The TRB has eliminated more than half of its committees including those focused on climate, equity, and cities.

Amtrak Rolls Out New Orleans to Alabama “Mardi Gras” Train
The new service will operate morning and evening departures between Mobile and New Orleans.
Urban Design for Planners 1: Software Tools
This six-course series explores essential urban design concepts using open source software and equips planners with the tools they need to participate fully in the urban design process.
Planning for Universal Design
Learn the tools for implementing Universal Design in planning regulations.
Heyer Gruel & Associates PA
JM Goldson LLC
Custer County Colorado
City of Camden Redevelopment Agency
City of Astoria
Transportation Research & Education Center (TREC) at Portland State University
Jefferson Parish Government
Camden Redevelopment Agency
City of Claremont