


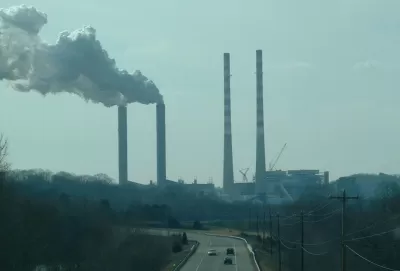
Analysis of global greenhouse gas emissions data points to the sectors, activities, and countries that are the biggest contributors.
Mengpin Ge and Johannes Friedrich review a series of charts from the World Resource Institute’s ClimateWatch greenhouse gas emissions data tool that show global trends.
The energy sector is responsible for almost three-quarters of greenhouse gas emissions. In the energy sector, the top three end-use activities are road transportation, residential buildings, and commercial buildings.
"Since 1990, three sectors stand out as the fastest-growing sources of greenhouse gas emissions: Industrial processes grew by 174%, transportation (a subsector of energy) by 71%, and manufacturing and construction (also a subsector of energy) by 55%," note Ge and Friedrich.
They also report that ten countries emit 68 percent of global greenhouse gas emissions, with China topping the list at 26 percent. In addition, carbon dioxide makes up almost three-quarters of emissions.
Ge and Friedrich say that cutting back on greenhouse gas emissions needs to happen around the world. "The largest emissions sources, like the energy sector, are good places to start. But to fully tackle the climate crisis, we will need deep reductions across all sectors, big and small."
FULL STORY: 4 Charts Explain Greenhouse Gas Emissions by Countries and Sectors


LA’s Trees Absorb More Carbon Than Expected, But Can’t Do It Alone
A USC study finds that Los Angeles’ urban trees absorb more carbon than expected, but while they provide crucial environmental benefits, they cannot replace the urgent need for systemic emissions reductions.

Judge Declares Federal Emissions Rule ‘Arbitrary and Capricious’
Another judge already vacated the rule nationwide before the latest case was decided.

Power Demand is Surging in US
The U.S. has entered a new power paradigm according to a new energy analysis that warns of unprecedented new demands for power, largely from “new manufacturing, industrial, and data center facilities,” and the grid is not prepared for the surge.

Maui's Vacation Rental Debate Turns Ugly
Verbal attacks, misinformation campaigns and fistfights plague a high-stakes debate to convert thousands of vacation rentals into long-term housing.

Planetizen Federal Action Tracker
A weekly monitor of how Trump’s orders and actions are impacting planners and planning in America.

San Francisco Suspends Traffic Calming Amidst Record Deaths
Citing “a challenging fiscal landscape,” the city will cease the program on the heels of 42 traffic deaths, including 24 pedestrians.

Defunct Pittsburgh Power Plant to Become Residential Tower
A decommissioned steam heat plant will be redeveloped into almost 100 affordable housing units.

Trump Prompts Restructuring of Transportation Research Board in “Unprecedented Overreach”
The TRB has eliminated more than half of its committees including those focused on climate, equity, and cities.

Amtrak Rolls Out New Orleans to Alabama “Mardi Gras” Train
The new service will operate morning and evening departures between Mobile and New Orleans.
Urban Design for Planners 1: Software Tools
This six-course series explores essential urban design concepts using open source software and equips planners with the tools they need to participate fully in the urban design process.
Planning for Universal Design
Learn the tools for implementing Universal Design in planning regulations.
Heyer Gruel & Associates PA
JM Goldson LLC
Custer County Colorado
City of Camden Redevelopment Agency
City of Astoria
Transportation Research & Education Center (TREC) at Portland State University
Jefferson Parish Government
Camden Redevelopment Agency
City of Claremont