


The New York Times created a visualization of air pollution that allows comparisons between local conditions and the worst air pollution in the world.

Nadja Popovich, Blacki Migliozzi, Karthik Patanjali, Anjali Singhvi, and Jon Huang are credited on this one-of-a-kind data visualization, which brings home the reality of air pollution.
Scroll through the article as floating particles make the point about air quality in cities around the world, and the air quality during events occurring with more frequency, like the Camp Fire in Paradise in 2018.
But even the Camp Fire can't compare to the reality in New Delhi, where air pollution reached "apocalyptic highs" last month. The causes and effects of air pollution are summarized thusly:
This fine pollution mainly comes from burning things: Coal in power plants, gasoline in cars, chemicals in industrial processes, or woody materials and whatever else ignites during wildfires. The particles are too small for the eye to see — each about 35 times smaller than a grain of fine beach sand — but in high concentrations they cast a haze in the sky. And, when breathed in, they wreak havoc on human health.
FULL STORY: See How the World’s Most Polluted Air Compares With Your City’s

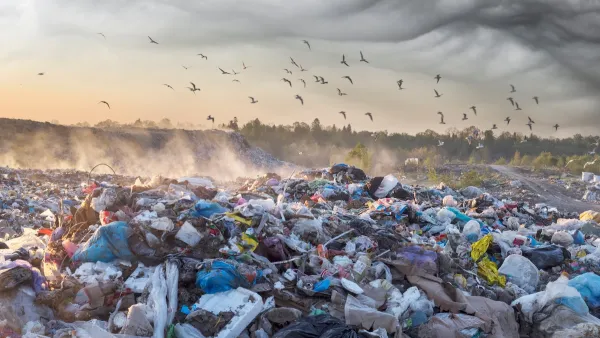
Colorado Landfills Emit as Much Pollution as 1M Cars
Landfills are the third-largest source of methane pollution in Colorado, after agriculture and fossil fuel extraction.

Driving Equity and Clean Air: California Invests in Greener School Transportation
California has awarded $500 million to fund 1,000 zero-emission school buses and chargers for educational agencies as part of its effort to reduce pollution, improve student health, and accelerate the transition to clean transportation.
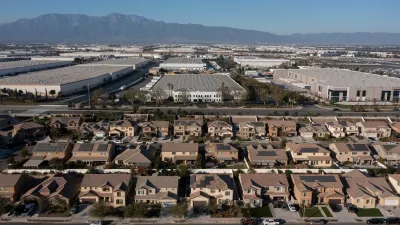
New California Law Regulates Warehouse Pollution
A new law tightens building and emissions regulations for large distribution warehouses to mitigate air pollution and traffic in surrounding communities.

Maui's Vacation Rental Debate Turns Ugly
Verbal attacks, misinformation campaigns and fistfights plague a high-stakes debate to convert thousands of vacation rentals into long-term housing.

Planetizen Federal Action Tracker
A weekly monitor of how Trump’s orders and actions are impacting planners and planning in America.

San Francisco Suspends Traffic Calming Amidst Record Deaths
Citing “a challenging fiscal landscape,” the city will cease the program on the heels of 42 traffic deaths, including 24 pedestrians.

Defunct Pittsburgh Power Plant to Become Residential Tower
A decommissioned steam heat plant will be redeveloped into almost 100 affordable housing units.

Trump Prompts Restructuring of Transportation Research Board in “Unprecedented Overreach”
The TRB has eliminated more than half of its committees including those focused on climate, equity, and cities.

Amtrak Rolls Out New Orleans to Alabama “Mardi Gras” Train
The new service will operate morning and evening departures between Mobile and New Orleans.
Urban Design for Planners 1: Software Tools
This six-course series explores essential urban design concepts using open source software and equips planners with the tools they need to participate fully in the urban design process.
Planning for Universal Design
Learn the tools for implementing Universal Design in planning regulations.
Heyer Gruel & Associates PA
JM Goldson LLC
Custer County Colorado
City of Camden Redevelopment Agency
City of Astoria
Transportation Research & Education Center (TREC) at Portland State University
Jefferson Parish Government
Camden Redevelopment Agency
City of Claremont