


Even some defenders of urbanism fear buildings that are tall enough for elevators. This fear does not seem to be supported by New York infection data.

As noted in my most recent post, there has been some media suggesting that COVID-19 is only a problem for those of us who live in cities and ride public transit. By and large, this argument has been thoroughly debunked; high-density nations like South Korea, Israel, and Taiwan all have suffered far less from COVID-19 than the United States, and the densest parts of Manhattan (and also of some other metro areas) are not necessarily the areas that have suffered the most.
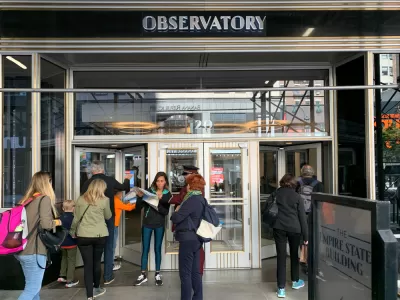
But even stalwart defenders of urbanism sometimes draw a distinction between low-rise walk-up urbanism (good) and elevators (bad). Their argument runs something like this: in elevators, you touch surfaces that other people touch (elevator buttons), which in turn might spread their infections to you. On the other hand, it is arguable that this risk a) is no more significant than the risk from passing another person walking down stairs or (b) can be eliminated by vigorous hand-washing after one leaves an elevator. (For more detailed discussion from a medical point of view see here.)
This argument made me curious about a related question: do neighborhoods with lots of elevators have more infections than neighborhoods with lots of walk-ups? We do have some data, although it is hardly flawless. New York City has data on the housing stock in various community districts, and has data on COVID-19 infections in various zip codes. Although community districts and zip codes are not identical, they still overlap to some extent.
The most heavily infected urban neighborhoods, with over 3,000 infections per 100,000 people, are in the northeast Bronx (Community districts 10, 11 and 12, which mostly overlap with zip codes 10465, 10461, and 10469), northwest central Queens (Community districts 3 and 4, which mostly overlap with zip codes 11368, 11369, 11370, and 11373), and southeastern Queens (Community district 13, which includes parts of zip codes 11412, 11428, and 11429). These are generally not the city’s highest-poverty areas; two of the six have poverty rates below the citywide average, and even the poorest has a 25.6 percent poverty rate by the city's definition, below the 30-35 percent rates prevalent in the South Bronx.
The only zip code with over 4,000 infections per 100,000 residents, 11369, overlaps with Community District 3 in Queens (Jackson Heights, Corona). In this district, 42.6 percent of all buildings are houses (that is, one- and two-family buildings), 18.3 percent are walk-up, and 9.3 percent have elevators. In other words, about 13 percent (9.3 of the 70 percent that are residential) have elevators. In District 4 just to its south, 28.1 percent of residential buildings are walkups, 27.2 percent are houses, and 10.9 percent are elevator buildings. Thus, elevator buildings are about 16 percent of the residential housing stock (10.9 out of 66.2 residential). District 13 is almost exclusively houses: only 3.8 percent of its buildings are either elevators or walk-up buildings.
In Bronx Community District 10, at the far edges of the East Bronx, 30.7 percent of buildings are houses (one or two-family homes), 6.2 percent are walkups, and 7.5 percent are elevator buildings. In other words, among the 43.3 percent of buildings that are residential, only about one-sixth are elevator buildings. Similarly, in District 11, only about 15 percent are elevator buildings (8.1 of the 56.1 percent that are residential). In District 12, about 10 percent are elevator buildings (5.6 percent out of 53.7).
What about the city’s least infected areas (under 900 per 100,000)? With the exception of Park Slope in Brooklyn, all of them are in Manhattan. Park Slope is in Community District 6; it is dominated by walk-ups, but no more so than many high-infection areas. 16 percent of its residential buildings (6.1 percent out of a total of 37.6 percent residential) are elevator buildings.
But as one might expect given Manhattan’s high-rise reputation, the least infected parts of Manhattan are elevator-dominated. Eight Manhattan zip codes have fewer than 900 infections per 100,000, and five of them are in the downtown Manhattan Community Districts 1, 2 and 3. In District 1, only 5.5 percent of all buildings are residential, and 4.7 percent have elevators; in other words, over 80 percent of residential buildings have elevators. In District 2 (a bit further north and west) there are more walk-up buildings: but even here half the residential buildings (13.5 percent, where 26.8 percent of all buildings are residential) have elevators. In District 3 to the east, 23.3 percent of all buildings are residential elevator buildings, and 7.8 are walk-ups; because only 0.2 percent of buildings are houses, this means almost 3/4 of all residential buildings have elevators. In other words, the least infected neighborhoods in New York have many, many more elevator buildings than do the most infected neighborhoods.
Of course, this analysis is subject to (at least) two qualifications. First of all, community districts do not overlap precisely with zip codes; if I had more data I could look at neighborhoods with more precision. Second, I do not pretend to make an "all else being equal" analysis; the high-infection neighborhoods tend not only to be poorer than downtown Manhattan, but also have much bigger household sizes. No zip code in downtown Manhattan has over 2.25 persons her household. By contrast, the most heavily infected zip code has 3.92 persons per household, and the majority of the higher-infection zip codes have over 3 persons per household. (More people living in your house, of course, means more possible sources of infection.)* So I do not think that I have proved that elevators are completely irrelevant to COVID-19- only that they are almost completely irrelevant.
*I note that some people debunk all New York-related data by claiming that Manhattanites, and only Manhattanites, have left town and are getting infections that are recorded in other jurisdiction. In this post, I show why this claim is not supported by data. It also defies common sense, since the people who can move most easily (young people with parents in the suburbs) are less likely to have symptoms of COVID-19 and thus less likely to be tested and diagnosed no matter where they lived.
LATER NOTE (5/19): The city recently issued data on deaths by zip code. The results seem pretty similar to the infection results: almost no deaths in Lower Manhattan, low death rates in other affluent parts of Manhattan, and higher death rates in working-class parts of Queens, Brooklyn and the Northeast Bronx.


Opinion: Upzone Now to Improve Commutes in the Post-Lockdown Future
Building more housing where people work is a simple way to come out of the pandemic with a stronger sense of community and shorter commutes, according to this article.
Blue-State Plague No More
A month or two ago, COVID-19 was primarily a Northeastern problem. Is that still the case?
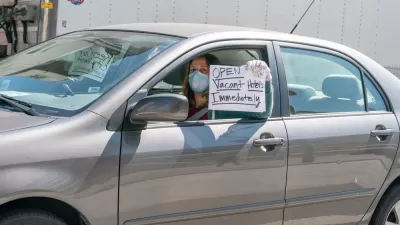
Hotels Could Play a Critical Role in Containing Coronavirus in Crowded Cities
Some cities are leasing entire hotels to provide rooms for people who have tested positive for COVID-19 or been exposed to infected people, to allow for safe and supportive isolation away from family or household members who risk being infected.

Planetizen Federal Action Tracker
A weekly monitor of how Trump’s orders and actions are impacting planners and planning in America.

Maui's Vacation Rental Debate Turns Ugly
Verbal attacks, misinformation campaigns and fistfights plague a high-stakes debate to convert thousands of vacation rentals into long-term housing.

San Francisco Suspends Traffic Calming Amidst Record Deaths
Citing “a challenging fiscal landscape,” the city will cease the program on the heels of 42 traffic deaths, including 24 pedestrians.

Amtrak Rolls Out New Orleans to Alabama “Mardi Gras” Train
The new service will operate morning and evening departures between Mobile and New Orleans.

The Subversive Car-Free Guide to Trump's Great American Road Trip
Car-free ways to access Chicagoland’s best tourist attractions.

San Antonio and Austin are Fusing Into one Massive Megaregion
The region spanning the two central Texas cities is growing fast, posing challenges for local infrastructure and water supplies.
Urban Design for Planners 1: Software Tools
This six-course series explores essential urban design concepts using open source software and equips planners with the tools they need to participate fully in the urban design process.
Planning for Universal Design
Learn the tools for implementing Universal Design in planning regulations.
Heyer Gruel & Associates PA
JM Goldson LLC
Custer County Colorado
City of Camden Redevelopment Agency
City of Astoria
Transportation Research & Education Center (TREC) at Portland State University
Jefferson Parish Government
Camden Redevelopment Agency
City of Claremont