


Transportation planning is undergoing a paradigm shift. The new paradigm is more multi-modal and comprehensive, and so can better respond to changing travel demands and emerging community needs.

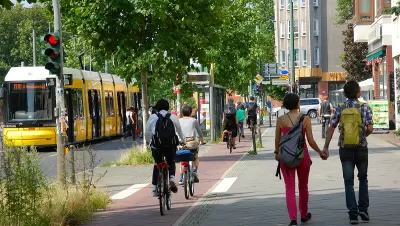
A recent post titled "Against Bicycles" on the Institute of Transportation Engineer's All Members Forum (copied below), criticized bicycle facilities. The author, Matt Warren, argued that bicycling is inefficient and unpopular, a passing fad with benefits too small to justify significant investments. Instead of bike lanes he recommends that bicyclists ride on sidewalks.
The post was obviously intended to provoke and it stimulated debate. Warren's arguments reflect, I believe, an outdated transportation planning paradigm [pdf], which undervalues walking, bicycling, and public transit. Rather than respond directly, I want to examine and respond to his criticisms. I hope that other transportation professionals will find this useful.
Walking, Bicycling, and Public Transit Are Inefficient
Warren argues that, because bicycles are unusable for most trips (he cites a 30-mile commute as an example), they are inefficient and unimportant. However, this ignores the many types of trips that walking, bicycling, and public transit can efficiently serve, and the inefficiencies that result if travelers are forced to drive for such trips due to inadequate facilities. For example, it is inefficient to force parents to chauffeur children to local destinations, such as schools, parks, and friends, due to inadequate sidewalks, crosswalks, and bike lanes in their neighborhood. Similarly, it is inefficient if a commuter must own a car and drive to work, and therefore impose road and parking facility costs, although they would rideshare or use public transit, and therefore save money and reduce their traffic impacts, if better services were available.
In other words, an efficient and fair a transportation system must be diverse [pdf] to serve diverse demands. This lets travelers choose the best option for each trip: active modes (walking and bicycling) for local travel, public transit when traveling on major urban corridors, and automobile travel when it is truly most efficient overall, considering all impacts.
In a typical community, 20-40% of trips should be made by non-auto modes due to travelers' age, disability, poverty, impairment, or preference, as summarized below.
|
Examples of Non-Auto Travel Demands
|
This indicates that in a typical community, 20-40% of travelers cannot, should not, or prefer not to drive. Failing to serve these non-auto travel demands creates numerous problems:
- It deprives non-drivers of independent mobility, preventing them from accessing desired destinations and economic opportunities.
- It forces drivers to spend time and money chauffeuring non-drivers.
- It forces non-drivers to walk and bike in unpleasant and unsafe conditions, and use inefficient and uncomfortable public transit services.
- It causes households to spend more than they can afford to own and operate motor vehicles.
- It increases high-risk driving, including impaired driving.
- It reduces physical fitness and health, increases traffic and parking congestion, traffic accidents and pollution emissions.
Walking, Bicycling and Public Transit Are Unimportant
Conventional travel statistics indicate that most travel (typically 85-95%) is by automobile, suggesting that other modes are unimportant, and their users are an insignificant minority. "That inconvenient minority will never displace the automobile," Warren argues. However, non-auto modes are used much more than these statistics suggest.
Most travel statistics undercount walking and bicycling trips because they undercount short trips (those within a traffic analysis zone), non-commute trips, travel by children, recreational travel, and walking and bicycling links of trips that include a motorized mode. For example, a bike-transit-walk trip is generally categorized as simply a transit commute, and the walking link from a parked car to a destination is generally ignored even if it involves several blocks of travel on sidewalks or roads. For these reasons, the most commonly cited mode share data only considers commute trips, and so tend to significantly undercount walking and bicycling trips. For example, the American Community Survey [pdf] indicates that 0.6% of commutes are by bicycle, 2.8% are by walking, and 5.2% used public transit, but the National Household Travel Survey indicates that considering all trips (not just commutes) about 1% bike, 2% use public transit, and 10% walk, with much higher rates in central cities. For example, in my region, 14.2% of trips are by walking and 5.0.% are by bicycling, but within the city of Victoria, 41% are by walking and 9% by bicycling, and within Downtown Victoria, 78% of trips are by walking. As a result, total walking and bicycling trips are generally much higher than conventional travel surveys indicate.
The Bicycling and Walking Benchmarking Reports [pdf] provide useful travel activity information, such as the graph below, which compares non-auto commute mode share for various U.S. cities. Total non-auto mode shares, including non-commute trips, are probably much higher than these statistics indicate.
Walking, Biking, and Transit Commute Mode Shares [pdf] (2013 American Community Survey Data)
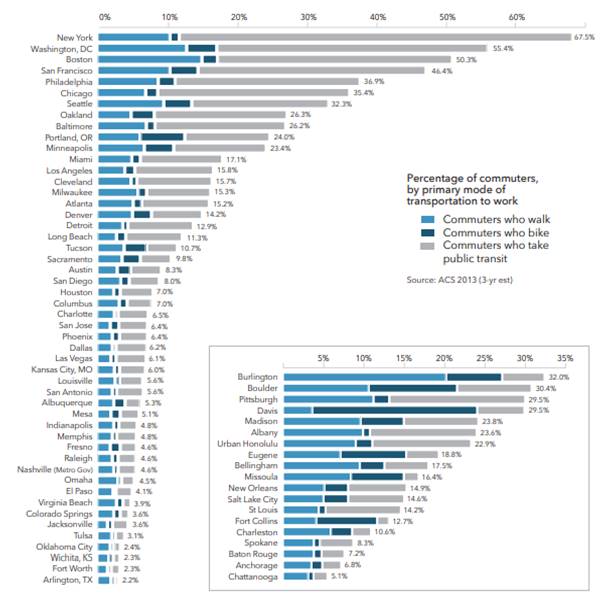
Since walking, bicycling, and public transit tend to be most common in denser urban areas, they can play a larger role in reducing urban traffic and problems. For example, bicycle mode share might be 2% at the regional level but 4% in the core city and 8% for trips to major commercial centers, schools and university campuses, so doubling its mode share could provide significant congestion reductions and tens of millions of dollars in parking cost savings, in addition to other benefits.
Should Planning Lead or Follow?
Warren argues that bicycle facilities should only be built where sufficient bicycling already occurs, but this overlooks latent demand, that is, additional bicycle trips that would be made if conditions improved. Many quality studies demonstrate that walking [pdf], bicycling [pdf], and public transit [pdf] improvements often increase use of these modes. In one case study, the U.S. Federal Highway Administration's Nonmotorized Transportation Pilot Program [pdf] invested about $100 per capita in pedestrian and cycling improvements in four typical communities (Columbia, Missouri; Marin County, Calif.; Minneapolis area, Minnesota; and Sheboygan County, Wisconsin), which caused walking trips to increase 23% and cycling trips to increase 48%, mostly for utilitarian purposes. Guo and Gandavarapu (2010) estimate that completing the sidewalk network in a typical U.S. town would increase average per capita active travel 16% and reduce automobile travel 5%, providing large total benefits.
Current demographic and economic trends [pdf] (aging population, increasing urbanization, increased health and environmental concerns), and changing consumer preferences are increasing demand for non-auto travel. Surveys indicate that many people would prefer to drive less, rely more on other modes, and live in more walkable and bikeable communities. For example, the National Association of Realtor's 2017 National Community Preference Survey found that most respondents like walking (80%), driving (73%), about half like bicycling, more than a third (38%) like public transit travel, and nearly 60% report being forced to drive due to inadequate alternatives. Younger people are much more likely to prefer walkable neighborhoods, bicycling, and transit travel, suggesting that demand for these modes will increase. Walkable community residents are also more satisfied with their quality of life.
Non-auto mode improvements tend to have synergistic effects, that is, an integrated program of appropriate improvements tends to have much greater impacts than if projects are considered individually. As a result, walking, bicycling, and public transit investments should be evaluated based on the future demand that would result from an integrated improvement program that includes a combination of facility improvements and incentives. For example, transportation planners could evaluate the value of increasing walking, bicycling, and public transit mode shares to the top level among peer communities.
It Is Unfair to Divert Transportation Dollars to Non-Auto Modes
Many people inaccurately believe that roads are financed by motor vehicle user fees (fuel taxes and road tolls), so it is unfair to divert transportation funds to non-auto modes. In fact, user fees finance only about half of total roadway costs, and a much smaller portion of expenditures on local roads where most walking, bicycling, and public transit travel occurs. According to Highway Statistics Report Table HF-10 in 2016, governments in the United States spent $219,001 on roadways (all figures in millions), of which $111,382 was financed by user fees, and local governments spent $75,635 on roadways, of which $5,363 was financed by user fees. The remaining roadway costs are financed by general taxes that residents pay regardless of how much they drive. Since walking and bicycling impose minimal roadway costs, people who drive less than average tend to overpay and subsidize the roadway costs imposed by their neighbors who drive more than average.
Overall, considering expenditures by all levels of government, a much smaller portion of total transportation funding is devoted to active modes than their share of travel. For example, although in a typical community 20-40% of travelers cannot, should not or prefer not to drive, and walking and bicycling represent 10-15% of total trips and 15-20% of traffic deaths, less than 2% of total government transportation infrastructure expenditures are devoted to walking and bicycling improvements. Increased funding is justified for fairness sake, to ensure that non-drivers receive their fair share of public investments.
Local Obstacles
Critics often argue that non-auto modes are infeasible in their community due to heat, cold, and hills, but experience indicates that these factors are less important than community commitment to multi-modalism. For example, many colder and hillier communities, such as Seattle, Washington and Missoula, Montana, have far more walking, bicycling, and public transit than mild climate and flatter communities such as Mesa, Arizona and El Paso, Texas.
Non-Auto Benefits
Critics tend to undervalue non-auto mode benefits. For example, Warren argues that bicycle improvements, "will not have health or pollution benefits," and he totally ignores other benefits. Improving non-auto transport, and increasing use of these modes can provide many significant benefits, as summarized in the following table.
Economic |
Social |
Environmental |
|
|
|
Walking, bicycling and public transit tend to be more resource-efficient, affordable and healthy than automobile travel, which provides various economic, social and environmental benefits. These are often overlooked or undervalued in conventional transport economic evaluation.
Community comparisons show significant, diverse benefits from more multi-modal transportation systems. Improving non-auto modes can provide large consumer savings, particularly if a comprehensive set of improvements allow a household to reduce vehicle ownership, for example, reducing the need for households to own a second car or allowing households to become car-free. This even reduces housing foreclosure rates.
Every automobile trip requires a parking space at its destination. A typical urban parking space has annualized costs of $500-1,500, and more for structured and underground parking facilities, and surveys [pdf] indicate that there are two to six off-street parking spaces per vehicle. Bicycle parking is much cheaper, and walking and public transit trips have virtually no parking costs. As a result, improving non-auto modes can provide large parking cost savings.
Improving non-auto modes can reduce traffic congestion [pdf], particularly if implemented with road or parking pricing. A major Arizona Department of Transportation study, Land Use and Traffic Congestion [pdf] found that households in more compact, mixed neighborhoods drive significantly less during peak periods and so experienced substantially lower congestion costs than in more sprawled, automobile-dependent areas. In more compact neighborhoods, residents' commute trips average seven miles and shopping trips less than three miles, compared with almost 11-mile commutes and more than four mile shopping trips in sprawled areas. Even if non-auto modes carry a minor portion of total regional travel, their shares tend to be much higher on congested urban corridors, and so can provide significant congestion reduction impacts.
Improving non-auto modes tends to provide large health benefits. Frederick, Riggs and Gilderbloom (2017) analyzed the relationships between commute mode share (the portion of commuters who do not drive an automobile, which ranges from 11% to 36%) and 12 public health and quality of life indicators for various mid-size U.S. cities and counties. After adjusting for various demographic factors, the results indicate a significant positive relationship between more modal diversity and positive public health outcomes including healthier behaviors reported in the Gallup/Healthway’s Well-Being Index, more leisure quality reported by Sperling’s Cities Ranked and Rated, more access to exercise reported by the Environmental Systems Research Institute, less sedentary living and obesity reported in the Center for Disease Control’s Diabetes Interactive Atlas, more Years of Potential Life Lost (an indicator of longevity and overall health), and higher birth weights (an indicator of infant health) reported by the National Center for Health Statistics.
Per capita traffic death rates [pdf] are much lower in more multi-modal than in automobile dependent communities. This makes sense: many traffic safety strategies, such as graduated drivers licenses, special testing for senior drivers, and anti-impaired driving campaigns, are designed to reduce high-risk driving, but this requires that youths, seniors ,and impaired people have suitable mobility options. Walking, bicycling, and public transit improvements make these available.
Conclusions
Transportation planning is undergoing a paradigm shift, a change in the way we think about problems and evaluate potential solutions. The old paradigm evaluated transportation system performance based primarily on motor vehicle traffic speed and safety, with little consideration to other modes and impacts. The new paradigm is more multi-modal and comprehensive. It recognizes non-auto travel demands, and a wide range of economic, social and environmental impacts, including vehicle ownership costs, parking costs, health impacts, and the benefits of providing independent mobility for non-drivers.
Current demographic and economic trends are increasing non-auto travel demands. Although few people want to give up driving altogether, surveys indicate that many people would prefer to drive less and rely more on walking, bicycling and public transit, provided that these options are convenient and comfortable to use. Responding to these demands require new planning practices. Transportation professionals can better serve their communities, and will have better career prospects, if they learn to apply more multi-modal and comprehensive planning.
Resources
ABW (2010-2016), Bicycling and Walking in the U.S.: Benchmarking Reports, Alliance for Biking & Walking.
Carlos Balsas (2017), “Blending Individual Tenacity with Government’s Responsibility in the Implementation of US Non-motorized Transportation Planning (NMT),” Planning Practice & Research, Vol. 32, Issue 2, Pages 197-211 (http://dx.doi.org/10.1080/02697459.2017.1286920).
Marlon G. Boarnet, et al (2017), The Economic Benefits of Vehicle Miles Traveled (VMT)- Reducing Placemaking: Synthesizing a New View, White Paper from the National Center for Sustainable Transportation (https://ncst.ucdavis.edu).
Michelle DeRobertis, John Eells, Joseph Kott, and Richard W. Lee (2014), “Changing the Paradigm of Traffic Impact Studies: How Typical Traffic Studies Inhibit Sustainable Transportation,” ITE Journal, May, pp. 30-35.
DfT (2010-2017), Transport Analysis Guidance, Integrated Transport Economics and Appraisal, Department for Transport. This website provides comprehensive guidance on how to identify problems, establish objectives, develop potential solutions, model highway and public transport, and conduct economic appraisal studies.
Economics of Active Transportation (www.ahtd.info/the_economics_of_active_transportation) by Active Healthy Transportation Developments (www.ahtd.info).
EVIDENCE (2014), How Urban Transport Projects are Appraised: Current Practice in the EU, by the Wuppertal Institute for Climate, Environment and Energy for the EVIDENCE Project: Economic Benefits of Sustainable Transport (http://evidence-project.eu).
John Gilderbloom, et al. (2015), “The Green Dividend of Urban Biking? Evidence of Improved Community and Sustainable Development,” Local Environment: The International Journal of Justice and Sustainability.
Matthew Holian and Ralph McLaughlin (2016), Benefit-Cost Analysis for Transportation Planning and Public Policy: Towards Multimodal Demand Modeling, Mineta Transportation Institute (http://transweb.sjsu.edu) for the California Department of Transportation.
Hanna Hüging, Kain Glensor and Oliver Lah (2014), The TIDE Impact Assessment Method for Urban Transport Innovations: A Handbook For Local Practitioners, TIDE (Transport Innovation Deployment for Europe) Project (www.tide-innovation.eu).
Kathy Kornas, et al. (2016), “Exploring Active Transportation Investments and Associated Benefits for Municipal Budgets: A Scoping Review,” Transport Reviews (DOI: 10.1080/01441647.2016.1252446).
Todd Litman (2015), Toward More Comprehensive and Multi-modal Transport Evaluation, Victoria Transport Policy Institute.
NZTA (2010-2017), Economic Evaluation Manual, Volumes 1 and 2, New Zealand Transport Agency (www.nzta.govt.nz).
Margo Pedroso (2017), Investing in Walking, Biking, and Safe Routes to School: A Win for the Bottom Line, Safe Routes to School National Partnership (www.saferoutespartnership.org).
Conor Semler, et al. (2016), Guidebook for Developing Pedestrian and Bicycle Performance Measures, Federal Highway Administration (www.fhwa.dot.gov/environment/bicycle_pedestrian).
Urban Design 4 Health and AECOM (2016), Active Transportation Health and Economic Impact Study, Southern California Association of Governments (http://urbandesign4health.com).
-----------------------------------------------------------------
Original Message:
(https://bit.ly/2LQbQdC ) Sent: 12-30-2018 11:24 PM
From: Matt Warren
Subject: Against Bicycles
Here are my final comments, condensed into one post for the sake of clarity although they address some content of various other replies.
This isn't the first time bicycles were going to Save the World. The Seventies were the decade of Pyramid Power, UFOs, frozen yogurt, and ten speeds. The Eighties were the decade of rusting ten speeds in yard sales. By 2030, gluten will be a health food and millions of new bicycles will be moldering in garages. The parking lot at Whole Foods will still be full of cars, and Walmart on Christmas Eve will still not be full of bicyclists sweating in their parkas.
Commuters will still drive. For someone who commutes 30 miles daily, that's probably 0.5-1+ hour of driving depending on congestion and controls; for a bicycle, 1.5-3+ hours depending on terrain and ability. Few people are going to give up several hours of each week even when the weather's good and they have nothing to carry. They surely won't do it for exercise - notoriously, people won't even take advantage of an air-conditioned gym with showers, after paying for a membership.
The only places where regular transportation bicycling is attractive are those with severe congestion, limited parking, level terrain, mild climate, and bicycle-friendly roads. We can change only one of those things.
There's nothing wrong with well designed bicycle lanes if there's an actual demand for them. If there's a choice between a negotiable sidewalk and riding adjacent to parked cars with no buffer, most bicyclists will take the sidewalk. If there are no bicyclists, it isn't the job of transportation engineers to build for them and hope they come.
Some roads are not good enough for 20 MPH on a mountain bike, at least in Oklahoma, and lots of sidewalks are fine for bicycling. In most cases pedestrians are sparse, can be seen at fair distance, and can be passed easily. A rider may have to slow down intermittently or continuously on a sidewalk, but not many are going to maintain a constant 15+ MPH anyway.
Bicycles, compared to cars, pose hardly any risk of severe injury or death to a pedestrian in a collision; perhaps more importantly, the bicyclist is more exposed to risk than the pedestrian, which naturally mitigates the behavior of the former more effectively than any law could. In any case, a collision between a bicycle and a pedestrian is preferable to a collision between an automobile and a bicycle. The only person qualified to judge whether and when a bicycle belongs on a sidewalk is the person riding it.
I have difficulty believing that anyone who has spent much time riding in traffic has failed to notice drivers going much further left than necessary to pass. A few years ago, I was passed while riding (within 1' of the edgeline of an 11' lane) by a police car (not in pursuit) that went entirely across the centerline and forced an oncoming car to make an emergency stop. Contrarily, very few cars over the years have passed me closer than I was comfortable with. Far from being aggressive, most drivers are excessively cautious around bicycles (I have seen a few refuse to pass a bicycle that was in a bike lane). Few drivers can tell when they are passing 3' away from a bicycle (3' is already wider than necessary), so they will either ignore the law or increase their passing clearance even more.
Nine MPH is a recreational speed. There is nothing wrong with using roads recreationally, but the primary function of the transportation system should be transportation - especially when transportation users outnumber recreational users by hundreds to one. Riders who can't ride in traffic should stick to bicycle lanes, shoulders, sidewalks, and neighborhood streets until they have more skill and confidence.
There is no reason bicyclists should not show ordinary courtesy to drivers. Since there are a small minority who make a point of riding for the explicit purpose of obstructing traffic, reasonable behavior should be required of cyclists by law. A good cyclist will go out of his way to allow cars to pass when practical; the one that wants to have a train of cars behind him belongs in jail, not on the road. I think I have made clear that I do not object to the majority making some sacrifice for the minority, but when a minority of a minority refuses to make any sacrifice themselves and even spits on the majority, tolerance has gone too far.
Most of those using bicycles for regular transportation are not cycling fanatics. They avoid blocking traffic, they are not organized to demand special favors, and they are not represented by the advocacy groups. Bicycles are not the problem; self-appointed cycling advocates and irrational laws are the problem.
------------------------------
Matt Warren P.E.
Professional Engineer
Free Agent

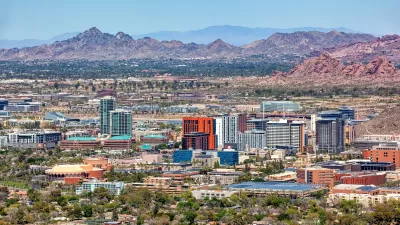
‘Tempe Tomorrow’ Plans for Expected Population Growth
Tempe planners are preparing a General Plan update scheduled for voter approval in March 2024.

Sioux Falls Multi-Family Development Outpaces Transportation Improvements
Sioux Falls, South Dakota is undergoing a multi-family development boom. Residents are increasingly concerned about the traffic the development brings, according to local news reports.

Ottawa’s New Transportation Master Plan Sets 20-Year Planning Priorities
Canada’s capital city recently completed the first step toward adopting a new Transportation Master Plan.

Planetizen Federal Action Tracker
A weekly monitor of how Trump’s orders and actions are impacting planners and planning in America.

Maui's Vacation Rental Debate Turns Ugly
Verbal attacks, misinformation campaigns and fistfights plague a high-stakes debate to convert thousands of vacation rentals into long-term housing.

San Francisco Suspends Traffic Calming Amidst Record Deaths
Citing “a challenging fiscal landscape,” the city will cease the program on the heels of 42 traffic deaths, including 24 pedestrians.

Amtrak Rolls Out New Orleans to Alabama “Mardi Gras” Train
The new service will operate morning and evening departures between Mobile and New Orleans.

The Subversive Car-Free Guide to Trump's Great American Road Trip
Car-free ways to access Chicagoland’s best tourist attractions.

San Antonio and Austin are Fusing Into one Massive Megaregion
The region spanning the two central Texas cities is growing fast, posing challenges for local infrastructure and water supplies.
Urban Design for Planners 1: Software Tools
This six-course series explores essential urban design concepts using open source software and equips planners with the tools they need to participate fully in the urban design process.
Planning for Universal Design
Learn the tools for implementing Universal Design in planning regulations.
Heyer Gruel & Associates PA
JM Goldson LLC
Custer County Colorado
City of Camden Redevelopment Agency
City of Astoria
Transportation Research & Education Center (TREC) at Portland State University
Jefferson Parish Government
Camden Redevelopment Agency
City of Claremont