Visualization Tools

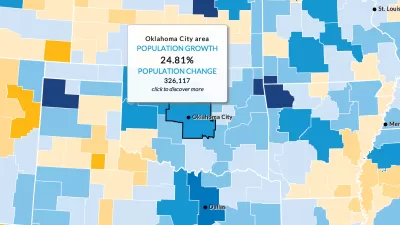
Smart Growth Loves Heatmaps
Smart growth can provide many important benefits that are easy to see using informative and beautiful heatmaps—our complex world as viewed by all-knowing gods.
Three Ways to Make GIS as Powerful as Possible
These days, cities are expected to make the most of open data and spatial visualization technologies.
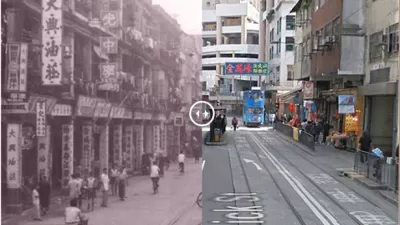
Historic Hong Kong: Visualizing a Changed City
Created with input from historian Mark Footer, this tool overlays street views of modern Hong Kong with historical photos from the colonial era through the 20th century.
'ManyCities' Uses Mobile Phone Data to Visualize Human Activity
A new online visualization tool makes it easier to read and understand data about mobile phone usage in four cities around the world, including Los Angeles and New York.

Mapping America's Homeless Populations
The Committee to End Homelessness in King County produced a helpful visualization tool that compares the size of homeless populations around the country as well as the type of housing support they receive.
Urban Design for Planners 1: Software Tools
This six-course series explores essential urban design concepts using open source software and equips planners with the tools they need to participate fully in the urban design process.
Planning for Universal Design
Learn the tools for implementing Universal Design in planning regulations.
planning NEXT
Appalachian Highlands Housing Partners
Mpact (founded as Rail~Volution)
City of Camden Redevelopment Agency
City of Astoria
City of Portland
City of Laramie