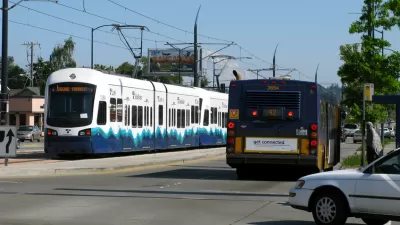
Cities that have recently adopted light rail sometimes actually add bus riders.

One common argument against new rail service is that rail cannibalizes bus ridership. One version of this argument is that riders of new light rail systems are nearly always former bus riders, so that any increase in rail ridership comes at the expense of bus ridership. A second version is that the costs of rail make it impossible for a region to maintain a first class bus system.
If the first claim was correct, regions that introduced new light rail would be the most likely regions to have reduced bus ridership. A new post at City Observatory suggests that the correlation between new rail and reduced ridership is pretty modest. Daniel Hertz, one of our nation's most interesting urban planning bloggers, has assembled data on bus ridership and service trends since 2000, including information from 39 urbanized areas with over 1 million people. His data shows that nine regions have experienced bus ridership losses of over 20 percent (Baltimore, Atlanta, Dallas, Cincinnati, Houston, Cleveland, Detroit, Milwaukee, San Jose). Four of these cities (Baltimore, Dallas, Houston, San Jose) have built significant new rail in the past couple of decades. But five other cities in America's Bus Ridership Dishonor Roll either lack significant rail service or (in the case of Cleveland) have primarily pre-2000 rail systems. By contrast, 30 other regions have experienced either ridership gains or more modest ridership losses: 13 of these regions have added new rail service, and 16 have not.* In other words, about one-fourth of the new rail cities (4 of 17) have suffered major ridership losses, and also about one-fourth of the other cities (5 of 22). Thus, the association between rail and reduced ridership is either nonexistent or fairly modest.
The association between new rail and bus service cuts is even weaker. Since 2000, six urbanized areas (Cleveland, Milwaukee, Pittsburgh, Detroit, San Jose, Houston) have reduced bus service, measured by route-miles, by over 20 percent. Only two of these regions (San Jose and Houston) have significant new light rail systems. (Two more, Cleveland and Pittsburgh, are "legacy rail" cities with significant but older rail systems).
What about more modest bus service cuts? I counted 17 cities that have added significant rail service since 2000. 10 of them have reduced bus route-miles to some extent, and 7 of them have added route-miles. By contrast, 5 of the 12 cities with no (or almost no) rail service have reduced bus service, as have 7 of the 10 "legacy rail" cities. Thus, new rail cities are more likely to have reduced service than "no rail" cities, but less likely than "legacy rail" cities. This suggests that the correlation between light rail and reduced bus service is pretty weak, if not nonexistent.
Moreover, some cities with new light rail have significantly increased both bus service and bus ridership. Charlotte is no. 1 in both; since 2000, ridership has increased by 80 percent and bus service by 65 percent. Phoenix, another new rail city, is no. 3 in ridership increases and no. 2 in service increases; both have increased by 57 percent since 2000. So even if new rail cities are more likely than other cities to reduce bus service, it does not appear that new rail cities consistently do so.
The examples of Charlotte and Phoenix also discredit the "empty bus" myth: the idea that increased bus service won't lead to increased bus ridership, because of Americans' alleged cultural aversion to buses. In fact, bus ridership grew by over 20 percent between 2000 and 2013 in seven major regions (Tampa, Charlotte, Phoenix, Miami, Jacksonville, Providence, Orlando)—and in all of them, by an odd coincidence, bus service increased. Bus service increased in 18 major regions, and ridership increased in 13 of them. On the other hand, bus service declined in 21 regions, and bus ridership decreased in 17 of them. (Interestingly, three of the four cities where bus ridership increased despite reduced bus service were cities with new rail- Seattle, Salt Lake City, and Los Angeles.) In sum, bus ridership usually increases in regions where bus service increases, and goes down when ridership goes down. So if you want more bus riders, add more buses.
It could be argued that falling ridership leads to service cuts rather than vice versa. If this were the case, places with drops in ridership in one year would have reduced service in the following year. Hertz shows, however, that this is rarely the case, and that the correlation between ridership declines and future service cuts is weak. He asserts that just 3 percent in year-to-year variation in service cuts is explained by prior-year bus ridership.
In sum, it appears that (1) at least some cities that have built more rail have also added bus service and (2) cities that have done so have usually experienced higher bus ridership.
*My list of "new rail" cities includes the following cities: San Diego, Portland, Salt Lake City, Seattle, Los Angeles, San Jose, Houston, Dallas, Austin, Baltimore, St. Louis, Sacramento, Riverside, Denver, Minneapolis, Phoenix, Charlotte. In the "no new rail" category I counted cities that, as of 2013, had (a) no rail (b) rail limited to a downtown streetcar/people mover or (c) a small number of commuter rail stops (Detroit, Kansas City, Milwaukee, Cincinnati, Memphis, Indianapolis, Columbus, San Antonio, Providence, Jacksonville, Orlando, Tampa) as well as "legacy rail" cities whose system was almost entirely built out by 2000 (Cleveland, Pittsburgh, New York, San Francisco, Chicago, Boston, Atlanta, and Washington). Since some of the latter cities did add capacity in the 2000s and most of my new rail cities had pre-2000 rail stops, I realize that one could reasonably categorize my some of "legacy cities" as "new rail" cities, and vice versa. I note that Orlando has commuter rail but its system began in 2014 and thus is too new to have any easily measurable effects on buses.

Maui's Vacation Rental Debate Turns Ugly
Verbal attacks, misinformation campaigns and fistfights plague a high-stakes debate to convert thousands of vacation rentals into long-term housing.

Planetizen Federal Action Tracker
A weekly monitor of how Trump’s orders and actions are impacting planners and planning in America.

In Urban Planning, AI Prompting Could be the New Design Thinking
Creativity has long been key to great urban design. What if we see AI as our new creative partner?

Massachusetts Budget Helps Close MBTA Budget Gap
The budget signed by Gov. Maura Healey includes $470 million in MBTA funding for the next fiscal year.

Milwaukee Launches Vision Zero Plan
Seven years after the city signed its Complete Streets Policy, the city is doubling down on its efforts to eliminate traffic deaths.

Portland Raises Parking Fees to Pay for Street Maintenance
The city is struggling to bridge a massive budget gap at the Bureau of Transportation, which largely depleted its reserves during the Civd-19 pandemic.
Urban Design for Planners 1: Software Tools
This six-course series explores essential urban design concepts using open source software and equips planners with the tools they need to participate fully in the urban design process.
Planning for Universal Design
Learn the tools for implementing Universal Design in planning regulations.
Gallatin County Department of Planning & Community Development
Heyer Gruel & Associates PA
JM Goldson LLC
City of Camden Redevelopment Agency
City of Astoria
Transportation Research & Education Center (TREC) at Portland State University
Jefferson Parish Government
Camden Redevelopment Agency
City of Claremont


