


New research indicates that smart growth helps residents become wealthier and healthier.


My column last week, How Not To Measure Housing Affordability, summarized some findings from Smart Growth America’s new report, Measuring Sprawl 2014, concerning the costs of sprawl and benefits of smart growth. This column examines this research in more detail.
Measuring Sprawl rated 221 metropolitan areas and 994 counties in the U.S. according to four primary factors: density (people and jobs per square mile), mix (whether neighborhoods had a mix of homes, jobs and services), centricity (the strength of activity centers and downtowns) and roadway connectivity (the density of connections in the roadway network). Based on this information it assigned a Sprawl Index score to each area. The index averages 100, meaning that scores lower than 100 indicate more sprawled areas and scores higher than 100 indicate smart growth.
The table below summarizes the study’s key results.
Summary of Sprawl Outcomes (Measuring Sprawl 2014)
|
Outcome |
Datasource |
Geography |
Relationship to Sprawl |
|
Housing affordability |
Location Affordability Index |
MSA |
positive and significant |
|
Transportation affordability |
Location Affordability Index |
MSA |
negative and significant |
|
Combined housing and transportation affordability |
Location Affordability Index |
MSA |
negative and significant |
|
Upward mobility |
Equality of Opportunity databases |
MSA |
negative and significant |
|
Average household vehicle ownership |
American Community Survey |
MSA, county, UZA |
positive and significant |
|
Percentage of commuters walking to Work |
American Community Survey |
MSA, county, UZA |
negative and significant |
|
Percentage of commuters using public transportation |
American Community Survey |
MSA, county, UZA |
negative and significant |
|
Average journey-to-work drive time in minutes |
American Community Survey |
MSA, county, UZA |
positive and significant |
|
Traffic crash rate per 100,000 population |
States |
County |
negative and significant |
|
Injury crash rate per 100,000 population |
States |
County |
negative and significant |
|
Fatal crash rate per 100,000 population |
States |
County |
Positive and significant |
|
Body mass index |
Behavioral Risk Factor Surveillance System (BRFSS) |
County |
Positive and significant |
|
Obesity |
BRFSS |
County |
Positive and significant |
|
Any physical activity |
BRFSS |
County |
Positive and significant |
|
Diagnosed high blood pressure |
BRFSS |
County |
Positive and significant |
|
Diagnosed heart disease |
BRFSS |
County |
Not significant |
|
Diagnosed diabetes |
BRFSS |
County |
Positive and significant |
|
Average life expectancy |
Institute for Health Metrics and Evaluation |
County |
negative and significant |
Here is what this means:
Affordability
The portion of household income spent on housing is greater, but the portion of income spent on transportation is lower, in smart growth communities. Each 10% increase in an index score was associated with a 1.1% increase in housing costs and a 3.5% decrease in transportation costs relative to income. Since transportation costs decline faster than housing costs rise, this results in a net decline in combined housing and transportation costs. This is consistent with Housing and Transportation (H+T) Affordability Index analyses.
Economic Mobility
Economic mobility refers to the degree that children born in poverty will be economically successful. Studies indicate that sprawl tends to reduce economic mobility by concentrating and isolating poverty, and by reducing non-drivers’ access to education and employment opportunities.Measuring Sprawl found that for every 10% increase in the index score, there is a 4.1% increase in the probability that a child born to a family in the bottom quintile of the national income distribution reaches the top quintile of the national income distribution by age 30.
Travel Activity
Smart growth community residents tend to own fewer motor vehicles, spend less time driving, and rely more on public transit and active modes. For every 10% increase in the index score:
- Vehicle ownership rates decline by 0.6%.
- The amount of time residents spend driving declines 0.5%.
- Transit mode share increases 11.5%.
- Walk mode share increases 3.9%.
Safety
Smart growth communities tend to have more traffic crashes (due to increased traffic density, that is, more vehicles per lane-mile, which increases the possibility of a crash), but they are less severe (because they occur at lower speeds). For every 10% increase in an index score, fatal crashes decrease by almost 15%.
Health
Smart growth community residents tend to live longer. For every doubling in the index score, life expectancy increases by about four percent. For the average American with a life expectancy of 78 years, this translates into a three-year difference in life expectancy between sprawled versus smart growth communities. This reflects significantly lower rates of traffic fatalities, obesity, high blood pressure and diabetes in smart growth communities, although these are somewhat offset by slightly higher air pollution exposure and murder risk.
This is consistent with findings in another new report, Bicycling and Walking in the U.S.: Benchmarking Report, which found a strong (R2=0.43) positive relationship between active transport (walking and cycling) commute mode share and the portion of the population that achieves national physical fitness targets of 150 weekly minutes of moderate physical activity. It also found strong negative relationships between active transportation commute mode share and rates of traffic accidents, obesity, high blood pressure and diabetes.
Bicycling and Walking in the U.S.: Benchmarking Report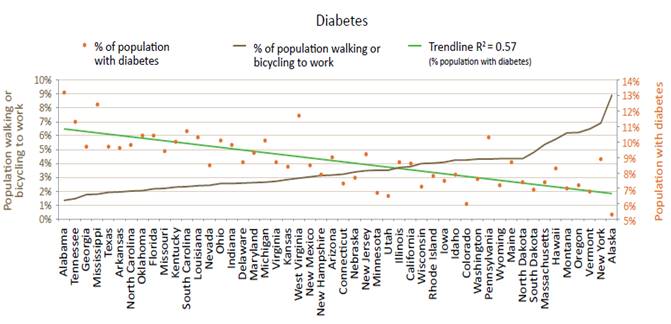
There is a strong negative correlation between active transport (walking and cycling) commute mode share and diabetes. Similar patterns are found for obesity and high blood pressure.
Walking and cycling mode shares are small overall, under 5% in most jurisdictions, which is insufficient to explain such large differences in health outcomes. These health impacts reflect the overall effects of different land use patterns: smart growth encourages regular walking and cycling for all types of travel, not just commuting. Simply encouraging commuters to walk and bike will have much smaller overall health and safety benefits than creating smart growth communities.
Summary
This is just a brief summary of some of the study’s findings. The full report, Measuring Urban Sprawl and Validating Sprawl Measures by the Metropolitan Research Center at the University of Utah, is extremely comprehensive and insightful.
This research has important implications for planners. It is our job to help communities understand trade-offs between conflicting objectives in order to identify optimal solutions, for example, affordable urban housing strategies, and policies that increase suburban/rural traffic safety and health. Solid, detailed research like this can provide useful guidance.
Well done Reid and Shima!
For More Information
1000 Friends (1999), “The Debate Over Density: Do Four-Plexes Cause Cannibalism” Landmark, 1000 Friends of Oregon.
ABW (2014), Bicycling and Walking in the U.S.: Benchmarking Reports, Alliance for Bicycling and Walking
Joe Cortright (2010), Driven Apart: How Sprawl is Lengthening Our Commutes and Why Misleading Mobility Measures are Making Things Worse, CEOs for Cities.
Todd Litman (2005), Understanding Smart Growth Savings: What We Know About Public Infrastructure and Service Cost Savings, And How They are Misrepresented By Critics, Victoria Transport Policy Institute.
Caroline Rodier, John E. Abraham, Brenda N. Dix and John D. Hunt (2010), Equity Analysis of Land Use and Transport Plans Using an Integrated Spatial Model, Report 09-08, Mineta Transportation Institute.
SGA (2014), Measuring Sprawl 2014, Smart Growth America.
SGN (2006), This Is Smart Growth, Smart Growth Network (www.smartgrowth.org) and the International City/County Management Association.
TransForm (2009), Windfall For All: How Connected, Convenient Neighborhoods Can Protect Our Climate and Safeguard California’s Economy, TransForm.
USEPA (2013), Our Built and Natural Environments: A Technical Review of the Interactions Among Land Use, Transportation, and Environmental Quality, U.S. Environmental Protection Agency.
USEPA (2013), Smart Growth and Economic Success: The Business Case, U.S. Environmental Protection Agency.


Maine Law Promotes Smart Growth
New state legislation encourages cities to plan around ‘smart growth’ principles to preserve farmland and open space, and use infill development to build more housing.

A Better Understanding of Smart Growth Benefits
Smart Growth creates compact, multimodal communities where residents consume less land, drive less, and rely more on non-auto modes. Planners have important stories to tell about the benefits of Smart Growth.

Getting to Work: New Commute Duration Heatmaps
The Mineta Transportation Institute's new interactive website produces heatmaps that illustrate commute duration—the number of minutes that workers spend traveling to their jobs—plus related information, for most U.S. communities.

Planetizen Federal Action Tracker
A weekly monitor of how Trump’s orders and actions are impacting planners and planning in America.

Chicago’s Ghost Rails
Just beneath the surface of the modern city lie the remnants of its expansive early 20th-century streetcar system.

Amtrak Cutting Jobs, Funding to High-Speed Rail
The agency plans to cut 10 percent of its workforce and has confirmed it will not fund new high-speed rail projects.

Ohio Forces Data Centers to Prepay for Power
Utilities are calling on states to hold data center operators responsible for new energy demands to prevent leaving consumers on the hook for their bills.

MARTA CEO Steps Down Amid Citizenship Concerns
MARTA’s board announced Thursday that its chief, who is from Canada, is resigning due to questions about his immigration status.

Silicon Valley ‘Bike Superhighway’ Awarded $14M State Grant
A Caltrans grant brings the 10-mile Central Bikeway project connecting Santa Clara and East San Jose closer to fruition.
Urban Design for Planners 1: Software Tools
This six-course series explores essential urban design concepts using open source software and equips planners with the tools they need to participate fully in the urban design process.
Planning for Universal Design
Learn the tools for implementing Universal Design in planning regulations.
Caltrans
City of Fort Worth
Mpact (founded as Rail~Volution)
City of Camden Redevelopment Agency
City of Astoria
City of Portland
City of Laramie