


The USDOT's "Conditions & Performance Report" predicts that VMT will grow between 1.36% and 1.85%, although current demographic and economic trends have resulted in flat or negative growth in recent years. Why won't they learn?

In December, as USDOT was preparing its updated Conditions & Performance report. Researchers at the State Smart Transportation Initiative took a look back at previous reports and found a consistent pattern of overestimates of motor-vehicle travel demand. They wondered about the new estimates: Will they be accurate this time?
Now we know. The answer is “no.”
The 2013 Conditions & Performance report, released 28 February 2014, does contain a nod to the 21stcentury trend of easing travel demand (expressed as vehicle-miles traveled or VMT). It provides two future trend lines for decision makers to consider.
As in past reports, one trend line is based on the Highway Performance Monitoring System (HPMS). This amounts to rolled-up estimates of demand from states and local transportation agencies. It estimates VMT growth at 1.85 percent annually—the same as that presented in the most recent 2010 report.
The other trend line, new for this report, is based on actual VMT growth from 1995 to 2010. It estimates VMT growth at a reduced rate of 1.36 percent annually. The three years since 2010 have all seen much lower growth than either estimate would suggest, -0.7 percent, 0.3 percent, and 0.6 percent respectively. So by 2013, the year the new report is dated, the new C&P was already estimating VMT that was 5 to 6 percent higher than actual, depending on which of the assumptions is used.
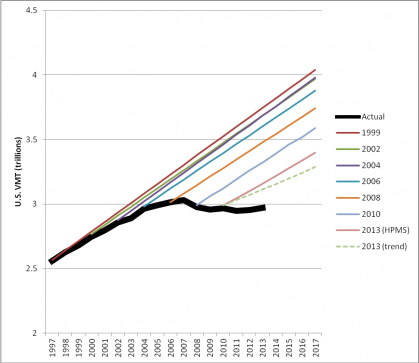
Figure 1. VMT predictions from USDOT’s Conditions & Performance (C&P) reports, compared with actual VMT from FHWA’s Travel Volume Trends reports.
That the HPMS-based estimate is unchanged indicates that many state and local DOTs have not adjusted their estimates to account for easing demand, continuing to base “needs” assessments for highway capacity on trend lines that overshoot reality. That both the HPMS and 15-year trend estimates continue to overstate highway travel calls into question budgeting conclusions in the report, as well as many similar conclusions at the state and local levels. The C&P report finds that the reduction from the HPMS to the 15-year trend implies a 24 percent drop, or $21 billion, in annual spending needed to maintain current roadway conditions and performance.
As the C&P points out, pavement conditions improve in the 15-year trend scenario, partly because of less wear and tear, but also because of changing investment priorities. From the report: “the lower projected future VMT causes HERS [Highway Economic Requirements System] to shift resources from capacity expansion to pavement improvements, resulting in better pavements.”
Had the report based estimates on more current historic data—e.g., VMT trends for 2003-13, which grew at one-fifth the USDOT’s 1995-2010 estimate—the cost estimates would have dropped by tens of billions more, reducing pressure on budgets while freeing up funds to bring the existing system to a state of good repair.
FULL STORY: U.S. DOT highway travel demand estimates continue to overshoot reality


Peak Car Revisited
U.S. vehicle travel increased 3.2% (8.6 billion vehicle miles) in total and 2.0% per capita between Junes 2015 and 2016. That is a new peak in total VMT, but a 2.75% reduction in per capita VMT. Will these growth rates continue into the future?
Changing Travel Demands: Implications for Planning
The graph below shows the most recent USDOT vehicle-travel data covering the last 25 years. Although vehicle-miles of travel (VMT) grew steadily during most of the Twentieth Century, in recent years the growth rate stopped and even declined a little. It is now about 10% below where it would have been had past trends continued.

Judge Halts Trump Order Tying State Transportation Grants to Immigration Actions
Ruling applies to Colorado, which was among 20 plaintiff states.

Maui's Vacation Rental Debate Turns Ugly
Verbal attacks, misinformation campaigns and fistfights plague a high-stakes debate to convert thousands of vacation rentals into long-term housing.

Planetizen Federal Action Tracker
A weekly monitor of how Trump’s orders and actions are impacting planners and planning in America.

In Urban Planning, AI Prompting Could be the New Design Thinking
Creativity has long been key to great urban design. What if we see AI as our new creative partner?

King County Supportive Housing Program Offers Hope for Unhoused Residents
The county is taking a ‘Housing First’ approach that prioritizes getting people into housing, then offering wraparound supportive services.

Researchers Use AI to Get Clearer Picture of US Housing
Analysts are using artificial intelligence to supercharge their research by allowing them to comb through data faster. Though these AI tools can be error prone, they save time and housing researchers are optimistic about the future.

Making Shared Micromobility More Inclusive
Cities and shared mobility system operators can do more to include people with disabilities in planning and operations, per a new report.
Urban Design for Planners 1: Software Tools
This six-course series explores essential urban design concepts using open source software and equips planners with the tools they need to participate fully in the urban design process.
Planning for Universal Design
Learn the tools for implementing Universal Design in planning regulations.
planning NEXT
Appalachian Highlands Housing Partners
Mpact (founded as Rail~Volution)
City of Camden Redevelopment Agency
City of Astoria
City of Portland
City of Laramie