


Recently, it’s been suggested that the collapse of the Ponzi scheme of spending and taxing inherent in sprawling development patterns may be responsible for pushing municipalities to the brink of bankruptcy. Ariel Godwin applies a quantitative analysis to examine whether there is, in fact, a correlation between city form and expenditures.
A CNN article recently featured on Planetizen discussed the question of whether sprawling development - and the infrastructure costs associated with it - places a strain on municipal budgets and drives some municipalities to bankruptcy. To what extent, the article asks, is sprawl responsible for these fiscal problems?
There are several ways in which this question could be tackled through quantitative analysis. One entertaining - and perhaps instructive - method is to compare the relative convolutedness of a city's boundary to its municipal expenditures.
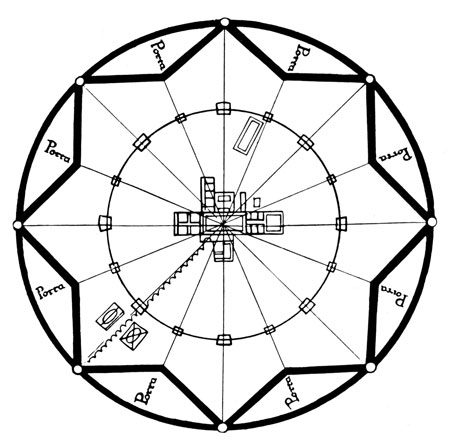
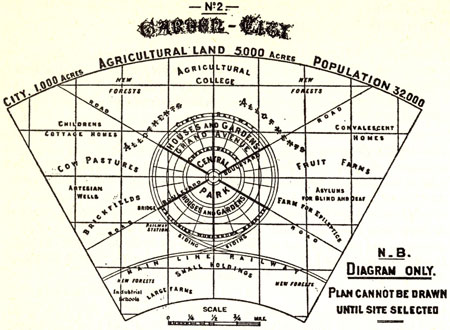
Consider the simple shapes of the "ideal cities" conceived throughout history. Imperial cities in ancient China were generally square or rectangular (Schinz, 1996; Steinhardt, 1999). Sforzinda, conceived by a 15th-century duke of Milan (but never built), would have had the shape of an eight-pointed star (Hub, 2011, p. 20) (see Figure 1). Ebenezer Howard's Garden Cities were designed in circular patterns (Fishman, 1982) (see Figure 2). These ideal cities were intended to be not only beautiful in form, but also efficient in function.
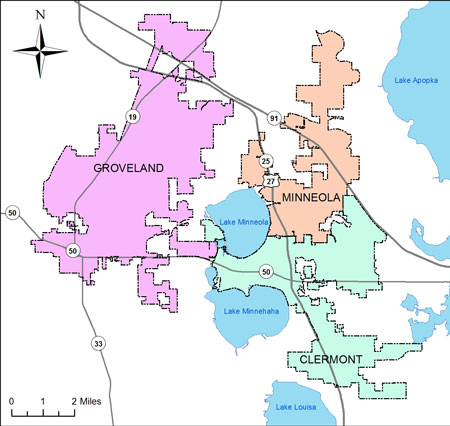
The typical modern American city is shaped like an amoeba extending multiple pseudopods (see Figure 3). While some cities are constrained into an odd shape by natural barriers, many of these amoebic municipalities have been shaped by annexation (see Figure 4).

Annexation in itself does not drive sprawl, and sprawl is an issue of the density of development rather than the shape of a city boundary. However, there are some connections between annexation, city boundaries, and sprawl. For example, a city that annexes land aggressively may encourage low-density development by making city services available on cheap land far from the city center. This effect is particularly visible in cities that strategically annex large tracts of land in order to capture potential development or compete with other cities. Aggressive annexation often results in a convoluted city boundary, and newly annexed land does not always generate the needed revenue, and can become a strain on municipal services, driving up total costs. Therefore, we ask the question: Are cities with more convoluted boundaries worse off than cities with more regular outlines? Does a municipality with more pseudopods spend more on services?
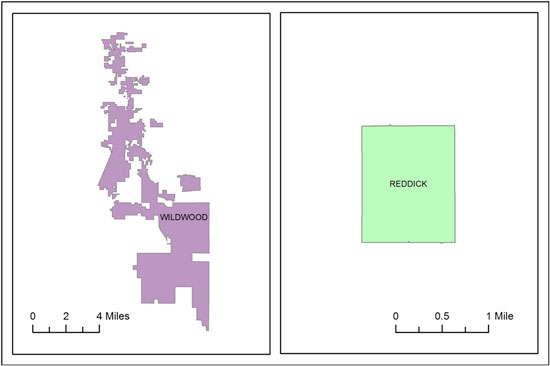
To tackle this question, this analysis uses the ratio of the city perimeter to the square root of the city's area to measure the convolutedness of a city boundary. (Using the square root is a way of controlling for city area; if we simply used the ratio of perimeter to area, the ratio would be smaller for a larger city and would not produce meaningful results). For a perfectly square city, the ratio will be 4, because the perimeter of a square is four times the square root of its area. The more convoluted the perimeter is, the higher the ratio will be. Figure 5 shows two cities typical of each extreme: quadrangular Reddick, Florida has a perimeter-to-square-root-of-area ratio of 4.1, while amoebic Wildwood, Florida has a ratio of 22.4.
This analysis compares the perimeter-to-square-root-of-area ratio to per capita municipal government expenditures and revenues for all municipalities in Florida, as reported by the Florida Office of Economic and Demographic Research, for the local fiscal year ending Sept. 30, 2009 (the most recent year for which an entire statewide dataset was available). I chose Florida for this analysis because of the aggressive annexation policies pursued by many of its municipalities (Fl. Senate, 2003, p. 2) and because the large number of municipalities in the state allows for a broader analysis (411 municipalities are included in this study). Municipal perimeters and areas were calculated from a GIS dataset downloaded from the Florida Geographic Data Library.
What types of municipal expenditure are most strongly correlated with this perimeter-to-square-root-of-area ratio? Table 1 shows the top ten.
Table 1. Strongest Correlations, Per Capita Expenditures
|
Account |
Correlation |
|
Special Recreation Facilities |
0.26 |
|
Fire Control |
0.22 |
|
Libraries |
0.21 |
|
Garbage / Solid Waste Control Services |
0.20 |
|
Pension Benefits |
0.19 |
|
Sewer / Wastewater Services |
0.18 |
|
Inter-Fund Group Transfers Out |
0.17 |
|
Protective Inspections |
0.15 |
|
Public Assistance Services |
0.11 |
|
Proprietary - Other Non-Operating Disbursements |
0.11 |
Of course, more annexed land can mean more tax revenue, and some categories of municipal revenues correlate with the perimeter-to-square-root-of-area ratio too. Table 2 shows the ten revenue categories with the strongest correlations:
Table 2. Strongest Correlations, Per Capita Revenues
|
Account |
Correlation |
|
Insurance Premium Tax for Firefighters' Pension |
0.26 |
|
Special Assessments - Capital Improvement |
0.25 |
|
General Gov't (Not Court-Related) - Internal Service Fund Fees and Charges |
0.24 |
|
Casualty Insurance Premium Tax for Police Firefighters' Retirement |
0.23 |
|
Physical Environment - Garbage / Solid Waste |
0.23 |
|
Fines - Library |
0.22 |
|
Culture / Recreation - Parks and Recreation |
0.22 |
|
Culture / Recreation - Libraries |
0.20 |
|
Proceeds of General Capital Asset Dispositions - Compensation for Loss |
0.20 |
|
State Shared Revenues - General Gov't - Local Gov't Half-Cent Sales Tax |
0.19 |
These are not very strong correlations, the strongest being 0.26. However, they are correlations, and they are positive (the strongest negative correlation in this analysis was only -0.10). Some correlations are of more interest than others. For this analysis, I was less interested in municipal expenditures on facilities that are used by people both inside and outside the municipality-such as libraries and parks-and more interested in essential services that are closely tied to annexation and are generally used only by municipality residents, such as sewer, water, and garbage services. Thus, it is significant that fire control, solid waste, and sewer services are all in the top ten list shown in Table 1. It is worth speculating here that costs tied directly to infrastructure-such as water and sewer services-might be inherently lower for a geometrically shaped city, where such systems could be planned and engineered more efficiently. Conversely, a convoluted city would require more convoluted infrastructure, at least in theory.
What can we conclude from this? There are plenty of less abstract ways to compare municipal governments to one another in terms of efficiency. Perimeter-to-square-root-of-area ratios seem unlikely to find their way into policymaking or to be used to inform annexation decisions. However, this analysis seems to validate the idea that as urban planners, we are sometimes right to give special consideration and thought to the shape and form of a city. Even in the case of arbitrary political boundaries, shape and form can sometimes have measurable effects.
We can only learn so much from analyzing the geometric shape of city boundaries. However, this analysis could form a background for further research examining the costs and benefits of annexation in more detail. Future research could examine municipal finances in relation to factors such as the rate at which annexation takes place; the location of annexed land with respect to potential development; or the strategic reasons for which annexation takes place.
Ariel Godwin is a planner and research analyst at the Central Florida Regional Planning Council. He has also worked as a regional transportation planner in Boston, MA and Columbus, OH. Prior to that, he worked as a freelance translator. He holds a master's degree in city and regional planning from Ohio State University.
Sources
Fishman, Robert (1982). Urban Utopias in the Twentieth Century: Ebenezer Howard, Frank Lloyd Wright, Le Corbusier. Cambridge: MIT Press.
Florida Office of Economic and Demographic Research. "Expenditures and Revenues Reported by Florida's Municipal Governments." http://edr.state.fl.us/Content/local-government/data/revenues-expenditures/munifiscal.cfm (retrieved June 17, 2012).
Hub, Berthold (2011). Foundation, Dedication and Consecration in Early Modern Europe. Leiden: Brill.
Schinz, Alfred (1996). The Magic Square: Cities in Ancient China. Fellbach: Axel Menges.
Steinhardt, Nancy Shatzman (1999). Chinese Imperial City Planning. Honolulu: University of Hawaii.
Florida Senate (2003). Interim Project Report 2003-115: "Does Current Law Adequately Address Delivery of Local Government Service Issues and Other Conflicts That Arise During Annexation?" http://archive.flsenate.gov/data/Publications/2003/Senate/reports/interim_reports/pdf/2003-115ca.pdf (retrieved June 17, 2012).


Colorado Springs Drafts New Regional Annexation Plan
A regional planning proposal in El Paso County, Colorado calls for uniform standards for unincorporated developments, which would make it easier to receive city services if annexed in the future.

San Antonio and Austin are Fusing Into one Massive Megaregion
The region spanning the two central Texas cities is growing fast, posing challenges for local infrastructure and water supplies.

Boulder Eliminates Parking Minimums Citywide
Officials estimate the cost of building a single underground parking space at up to $100,000.

Planetizen Federal Action Tracker
A weekly monitor of how Trump’s orders and actions are impacting planners and planning in America.

Chicago’s Ghost Rails
Just beneath the surface of the modern city lie the remnants of its expansive early 20th-century streetcar system.

Amtrak Cutting Jobs, Funding to High-Speed Rail
The agency plans to cut 10 percent of its workforce and has confirmed it will not fund new high-speed rail projects.

Ohio Forces Data Centers to Prepay for Power
Utilities are calling on states to hold data center operators responsible for new energy demands to prevent leaving consumers on the hook for their bills.

MARTA CEO Steps Down Amid Citizenship Concerns
MARTA’s board announced Thursday that its chief, who is from Canada, is resigning due to questions about his immigration status.

Silicon Valley ‘Bike Superhighway’ Awarded $14M State Grant
A Caltrans grant brings the 10-mile Central Bikeway project connecting Santa Clara and East San Jose closer to fruition.
Urban Design for Planners 1: Software Tools
This six-course series explores essential urban design concepts using open source software and equips planners with the tools they need to participate fully in the urban design process.
Planning for Universal Design
Learn the tools for implementing Universal Design in planning regulations.
Caltrans
City of Fort Worth
Mpact (founded as Rail~Volution)
City of Camden Redevelopment Agency
City of Astoria
City of Portland
City of Laramie