


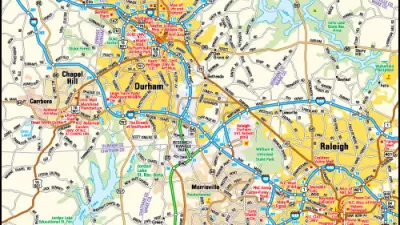
Want to know how long it will take to pick up the kids at school, drive to your favorite restaurant, drive the baseball game, take the bus to the park? And all at once? Trulia's new innovative map does just that.
Want to know where exactly you can and can't go in the next hour? Trulia's new map service can show you a "heat-map" of the places you can travel within a certain time limit, and by either public transit or by automobile.
As Mark Wilson of Fast Company reports, "...in a single search, you can spot the congestion of an entire city and plan your day accordingly...Maybe you're a tourist in a new town. You'd like to hit up some sites, but you have no idea how much time to plan. Or maybe you're juggling errands on the weekend, and you want to hit up whichever stores are lightest on traffic first."
After some playing around with the maps, and reading the comments of other users, the maps do seem to be off in some ways. Arrival times for suburban and rural areas tend to be drastically misjudged, usually off by twice the normal time it would take to get there by automobile. But, for larger and traffic-clogged metros at peak rush hours, the times seem to be, for the most part, correct.
As one commenter put it, "[r]oadway classification seems to be downplayed too much, as in local streets moving almost as fast as major arterials. Are signalized or signed intersections assigned impedance values?...what time of day is this? Is this a weekday or a weekend? I hope under/overpasses are uncoupled. The data is out there to support such an analysis, but it will cost you dear." Still, it's worth a try.
FULL STORY: Trulia’s New Maps Show Your Commute Time From Your New House


Friday Funny: Cartographers Are Hiding an Idyllic Continent
The rest of the world would only spoil it for the mapmakers.
Friday Eye Candy: Highly Detailed Cold War Era Soviet Maps of the U.S.
A new book sheds light on maps created by cartographers in the Soviet Union that dove into remarkable detail about buildings, transportation networks, and other infrastructure in cities across the United States and around the world.

Friday Eye Candy: The Childhood Maps of 8 Professional Mapmakers
Choosing cartography as a career is a natural result of a lifelong love of maps. National Geographic gathers the proof.

Maui's Vacation Rental Debate Turns Ugly
Verbal attacks, misinformation campaigns and fistfights plague a high-stakes debate to convert thousands of vacation rentals into long-term housing.

Planetizen Federal Action Tracker
A weekly monitor of how Trump’s orders and actions are impacting planners and planning in America.

In Urban Planning, AI Prompting Could be the New Design Thinking
Creativity has long been key to great urban design. What if we see AI as our new creative partner?

King County Supportive Housing Program Offers Hope for Unhoused Residents
The county is taking a ‘Housing First’ approach that prioritizes getting people into housing, then offering wraparound supportive services.

Researchers Use AI to Get Clearer Picture of US Housing
Analysts are using artificial intelligence to supercharge their research by allowing them to comb through data faster. Though these AI tools can be error prone, they save time and housing researchers are optimistic about the future.

Making Shared Micromobility More Inclusive
Cities and shared mobility system operators can do more to include people with disabilities in planning and operations, per a new report.
Urban Design for Planners 1: Software Tools
This six-course series explores essential urban design concepts using open source software and equips planners with the tools they need to participate fully in the urban design process.
Planning for Universal Design
Learn the tools for implementing Universal Design in planning regulations.
planning NEXT
Appalachian Highlands Housing Partners
Mpact (founded as Rail~Volution)
City of Camden Redevelopment Agency
City of Astoria
City of Portland
City of Laramie