


Over the past few years a variety of documents ranging from contemporary media to more serious research efforts have addressed the cost of auto ownership and use. These estimates are often used to address two important transportation issues, the household benefits of using transit in lieu of auto ownership and/or the consideration of household location decisions in the context of the total cost of housing and transportation. Two often referenced sources of research on these issues are the Center for Neighborhood Technology’s (CNT) initiatives in developing a housing and transportatio

Over the past few years a variety of documents ranging from
contemporary media to more serious research efforts have addressed the cost of
auto ownership and use. These estimates
are often used to address two important transportation issues, the household
benefits of using transit in lieu of auto ownership and/or the consideration of
household location decisions in the context of the total cost of housing and
transportation. Two often referenced sources of research on
these issues are the Center for Neighborhood Technology's (CNT) initiatives in
developing a housing and transportation affordability Index and the AAA updates
on auto operating cost estimates[i]. These initiatives are noble efforts in our
march toward holistic thinking about transportation and transportation policy. Transportation costs – both financial and
others – are important considerations in both household decisions and
infrastructure planning and investment policy decisions.
While estimating vehicle ownership and use costs can be of value
in making decision makers – including individual travelers – aware of
transportation costs that might otherwise not be transparent or accurately
perceived, there are some risks associated with failing to more carefully
explore the various estimates of transportation costs. Citing something a lot does not automatically
make it true or the most appropriate piece of information to use.
The CNT transportation cost estimates are based on a
model that produces household transportation costs for major metro areas in the
US with estimated values typically ranging from just over $10,000 to in excess
of $15,000 for personal vehicle ownership costs per household per year. Alternatively, the Bureau of Labor Statistics
Consumer Expenditure Survey estimates national average household spending on
transportation to be under $8,000 per year. And as anyone knows from driving down a
residential street in America and in talking to their friends and neighbors,
the vehicle transportation spending varies dramatically based on travel levels
and consumer tastes and priorities as it relates to vehicle investment and use. The
AAA produces their annual "Your Driving Costs" which
produces an annually updated cost of vehicle ownership based on a five year
ownership period and 15,000 mile per year travel rate and produces an annual
cost of $8,946 or $0.596 per mile for 2012[ii]. The IRS allowed $0.555 per mile for business
use of personal vehicles in the second half of 2011.
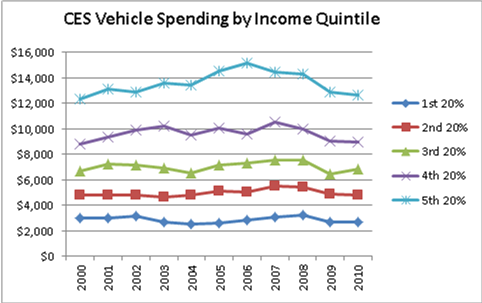
Using the newest Consumer Expenditure Survey (CES) data from
2010, the average US household is reported to spend $7,667 per year on all travel
of which $7,184 per year is attributed to vehicle travel[iii]. Based on national household travel survey
data from 2008 – 2009, the average household had 2.1 vehicles, each of which
was driven approximately 9,460 miles annually[iv]. This data produces an estimated per mile
vehicle ownership and operating cost of approximately $0.36. If divided by an average occupancy of 1.67 it
results in an approximate $0.22 per passenger mile expenditure.
Figure 1 shows the spending trend on vehicle travel by
income quintile from Consumer Expenditure Survey data. Costs aren't particularly high and are not
growing – actually shrinking if adjusted for inflation - in spite of generally
rising fuel and vehicle costs[v].
The disparity between various high estimates of auto
ownership and operating costs and the measured average captured by the Consumer
Expenditure Survey partially lies in the very meaningful differences between
new car ownership and the reality that much of America isn't driving new cars
with high depreciation levels. Average
vehicle retention has increased to 71 months meaning that households are
retaining vehicles nearly 6 years, a trend attributed to both longer financing
terms and longer warrantees and improved vehicle reliability. The average age of autos has reached a record
high 10.8 years as of July 2011.[vi] In the U.S. light vehicles were noted in a
2006 study to be nearly 18 years old with approximately 170,000 miles on them
when they were scrapped on average[vii]. Depreciation costs become insignificant at
some point.
It's easy to see how ownership cost get quite high
with luxury and near luxury vehicle leases running above $500 per month plus equity
investment, insurance, gas, parking, etc. and it's not hard to imagine cost per
vehicle at or above the kinds of numbers cited by CNT or AAA. On the other hand, the young person or low
income worker who is driving aunt Martha's hand-me-down 14-year-old Ford or
Toyota that they purchased for a few hundred dollars, maintain in their driveway,
and drive with minimal insurance if any (various estimates suggest that as many
as 30% of vehicles do not have automobile insurance) might be defining the
other end of the household vehicle travel expenditure range[viii].
Unless one chooses not to believe the Consumer
Expenditure Survey data, Middle America has managed to control personal vehicle
expenditure costs making personal mobility surprisingly inexpensive. While this ignores the indirect costs and
perhaps understates other costs (arguably we are under investing in
transportation infrastructure and recent evidence suggests we've been
depreciating our vehicle fleet asset as well) and there seems to be an
increasing trend to use general revenue streams such as impact fees and
property taxes to support transportation infrastructure, thus leaving some
costs out of vehicle ownership and use cost estimates. But consumers are likely to make
economic decisions based on the direct costs that they bear.
So what does this all mean in terms of transportation policy
and planning? Clearly, many American
consumers of travel are not basing their travel decisions on vehicle ownership
and use costs that are nearly as high as those referenced in various resources and
research reports- several of which reflect an advocacy perspective. Take for example somebody seriously thinking
about using transit and perhaps giving up a household vehicle. In all probability they would be giving up a
lower cost/value vehicle – perhaps one that was fully depreciated or needed to
be replaced. There would be some savings
in operating cost but a significant share of the household mileage would likely
be shifted to the remaining household vehicles with increases in their
operating costs and depreciation rate. Persons
sensitive to travel costs who might be considering this decision are likely to
be individuals in low to moderate income categories where their household
spending on vehicle travel might be below or well below the mean levels of the
total population. Interestingly,
consumer expenditure data also show that even zero-vehicle households have
significant spending on vehicle travel. Giving
up or not purchasing a household vehicle is more likely to result in the use of
rental and/or borrowed vehicles or providing gas money to friends and family
for providing trips. Thus, presumptions
about total savings from relinquishing a vehicle need to reflect the full reality
of how travelers are behaving.
Data indicate that consumers have made decisions to reduce
auto ownership – or the economy has made it for them. Auto ownership levels have declined. While stories about home foreclosures are
regular headlines, less noticed is the reduction in personal vehicle ownership
from approximately 236 to 230 million registered vehicles nationally between
2008 and 2010[ix].
Assumptions about travel cost savings associated with
various residential location choices also require review relative to other
sources of household spending on travel. Again, there can be large variations in
context. For example, 27.2% of US
households have no workers in them – thus, their household travel costs can be
more controlled by their own choice decisions regarding trip destinations for
their travel. Another few percent (and
growing) have work-at-home members of the labor force. Unfortunately, fixed costs associated with
relocating a household particularly for home owning households, make
optimization of household location with respect to employment or travel generally
an unpromising proposition in an era of job mobility, multi-worker households, upside
down home-equity, and significant home purchase/sale transactions costs. However, recent data suggest a decline in
homeownership – while a consequence of the economic conditions, this perhaps provides
an opportunity to enable more households to more easily minimize commuting
costs[x].
While pointing out potential auto operating savings might be
an appropriate strategy for an advocacy entity, serious policy deliberations
are misinformed if they don't use a far more nuanced and empirically based set
of data on household travel expenditures and travel behavior as well as recognizing
the full costs of accommodating the changes in behavior, be they increased
transit demand and the corresponding costs or changes in population and employment
location preferences.
Consumers are generally rational creatures making what in
their eyes are sound decisions on spending.
It is important that planners and policy makers appreciate the revealed behavior
of various segments of the population when they make their location, vehicle
ownership, and mode choice decisions. Travel
costs are a factor in vehicle ownership, mode choice and household location
decision-making, but perhaps these costs are not well represented by the
savings potential that some analyses are implying or contending.
[viii]
LOWER-INCOME HOUSEHOLDS AND THE
AUTO INSURANCE MARKETPLACE: CHALLENGES AND OPPORTUNITIES, Stephen Brobeck and J. Robert
Hunter, January 30, 2012, http://www.consumerfed.org/news/450
[x] Home
ownership dropped from 68 to 62 percent from 2011 to 2012, according to an
April 2012 Gallup Survey. http://www.gallup.com/poll/154124/U.S.-Homeownership-Hits-Decade-Low.aspx

Boston-Area Bikeshare Findings Help Identify Planning Priorities
An analysis of Lime bikeshare data from Boston suburbs is providing useful information about travel behavior and trends.
Ride-Hailing Report Examines Effects on Chicago's Congestion
A new report looks at how the increase of ride-hailing in Chicago is affecting infrastructure and mobility.

L.A. Metro Report Examines How Women Travel
Findings from a new study about the mobility needs and concerns of women in Los Angeles will inform future initiatives and planning.

Maui's Vacation Rental Debate Turns Ugly
Verbal attacks, misinformation campaigns and fistfights plague a high-stakes debate to convert thousands of vacation rentals into long-term housing.

Planetizen Federal Action Tracker
A weekly monitor of how Trump’s orders and actions are impacting planners and planning in America.

San Francisco Suspends Traffic Calming Amidst Record Deaths
Citing “a challenging fiscal landscape,” the city will cease the program on the heels of 42 traffic deaths, including 24 pedestrians.

Defunct Pittsburgh Power Plant to Become Residential Tower
A decommissioned steam heat plant will be redeveloped into almost 100 affordable housing units.

Trump Prompts Restructuring of Transportation Research Board in “Unprecedented Overreach”
The TRB has eliminated more than half of its committees including those focused on climate, equity, and cities.

Amtrak Rolls Out New Orleans to Alabama “Mardi Gras” Train
The new service will operate morning and evening departures between Mobile and New Orleans.
Urban Design for Planners 1: Software Tools
This six-course series explores essential urban design concepts using open source software and equips planners with the tools they need to participate fully in the urban design process.
Planning for Universal Design
Learn the tools for implementing Universal Design in planning regulations.
Heyer Gruel & Associates PA
JM Goldson LLC
Custer County Colorado
City of Camden Redevelopment Agency
City of Astoria
Transportation Research & Education Center (TREC) at Portland State University
Jefferson Parish Government
Camden Redevelopment Agency
City of Claremont