


In a recent post, Todd Litman criticized the Texas Transportation Institute's Urban Mobility Report. In this post, I'd like to do something a little different: assume that TTI's congestion estimates are more or less reliable, and try to learn something from them. So here are a few observations:

In a recent post, Todd Litman criticized the Texas Transportation Institute's Urban Mobility Report. In this post, I'd like to do something a little different: assume that TTI's congestion estimates are more or less reliable, and try to learn something from them. So here are a few observations:
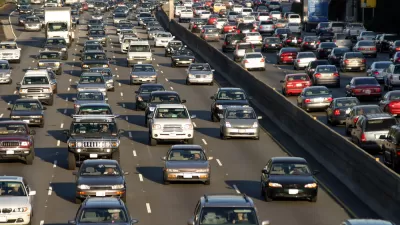
1. Congestion isn't (consistently) rising anymore. Out of the nation's 15 largest urban areas, five (Seattle, San Francisco, Atlanta, Los Angeles and Detroit) benefitted from decreased traffic congestion (measured by hours lost per driver) between 1999 and 2009. On the other hand, congestion continued to rise in some places- for example, by 38% in Houston (from 42 to 58).
2. Highway-building didn't seem to help. Two of the five congestion-reducers built enough highway lane-miles to increase lane-mileage per person (San Francisco and Detroit). But three others did not. In Altanta, the number of lane-miles increased by 7 percent from 1999 to 2009 (from 2350 to 2520). But population increased from 3.7 million to 4.2 million (a 13 percent increase). So road-mileage per person actually decreased, yet congestion decreased from 49 miles per driver per year to 44. In Seattle (where congestion hours went from 52 per motorist in 1999 to 44 in 2009), a 20 percent regional population increase was not matched by road growth: freeway mileage increased from 1600 to 1855 miles, only a 9 percent increase. In Los Angeles, freeway mileage and population were almost evenly matched. Regional population increased from 12.3 million to 13 million (about a 6 percent increase) while freeway miles increased from 5400 to 5610 (a 4 percent increase). Yet congestion nosedived from 76 hours per person/year to 63.
What happened in regions that failed to beat congestion? In four of our nation's fifteen largest regions (Chicago, Dallas, Philadelphia, and Houston) hours lost to congestion increased by over 20% between 1999 and 2009. In three of those, freeway mileage increased faster than population.
3. Density was of limited importance. This is a difficult issue because there are so many ways of measuring density: central city density, urbanized area density, and even attempts to combine the two. But it seems to me the most rational way of dividing large U.S. metro areas is between "transit metropolises" (places where at least in the central city more than 20% of commuters ride transit) and "car cities" (in varying degrees, everyplace else). There are six large "transit metropolises" in the United States: Washington, Boston, Chicago, Philadelphia, New York, and San Francisco. Did they have more congestion than other megaregions like Dallas and Houston? Sometimes. On the one hand, Washington and Chicago were nos. 1 and 2 in congestion. On the other hand, the other four metropolises were somewhere in the middle, ranging from No. 5 among the 15 largest urban areas (New York) to No. 11 (Philadelphia). Thus, the relationship between urban form and congestion does not appear to be enormous.

Three Studies That Show Density Doesn't Determine Car Travel
Thirty years after a seminal study attempted to connect increased density with decreased automobile use, several new studies are raising doubts about that central assumption of contemporary planning.

Study: Reduce Traffic with Mixed-Use Development
A new study explores how the built environment influences vehicle miles traveled.
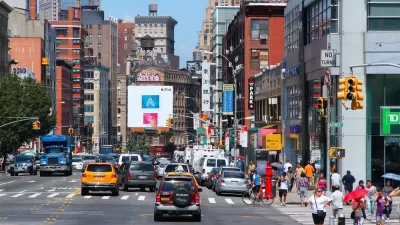
The Los Angeles Mystery
A blog post exploring why Los Angeles is more car-dependent than some less dense cities.

Maui's Vacation Rental Debate Turns Ugly
Verbal attacks, misinformation campaigns and fistfights plague a high-stakes debate to convert thousands of vacation rentals into long-term housing.

Planetizen Federal Action Tracker
A weekly monitor of how Trump’s orders and actions are impacting planners and planning in America.

In Urban Planning, AI Prompting Could be the New Design Thinking
Creativity has long been key to great urban design. What if we see AI as our new creative partner?

King County Supportive Housing Program Offers Hope for Unhoused Residents
The county is taking a ‘Housing First’ approach that prioritizes getting people into housing, then offering wraparound supportive services.

Researchers Use AI to Get Clearer Picture of US Housing
Analysts are using artificial intelligence to supercharge their research by allowing them to comb through data faster. Though these AI tools can be error prone, they save time and housing researchers are optimistic about the future.

Making Shared Micromobility More Inclusive
Cities and shared mobility system operators can do more to include people with disabilities in planning and operations, per a new report.
Urban Design for Planners 1: Software Tools
This six-course series explores essential urban design concepts using open source software and equips planners with the tools they need to participate fully in the urban design process.
Planning for Universal Design
Learn the tools for implementing Universal Design in planning regulations.
planning NEXT
Appalachian Highlands Housing Partners
Mpact (founded as Rail~Volution)
City of Camden Redevelopment Agency
City of Astoria
City of Portland
City of Laramie