New Analysis Tools Measures Transportation Health Impacts

The Integrated Transport and Health Impact Model estimates how planning decisions affect public health, including physical activity, collisions and vehicle exhaust. This can help create healthier communities.

2 minute read

November 27, 2020, 6:00 AM PST

By Todd Litman


Tailpipe

Fabianodp / Shutterstock

The Healthy Mobility Options Tool is a new health impact analysis model that quantitatively answers the question of “How much benefit or harm to human health can we expect by changing the mix of active and motorized travel across a county, region, or the entire state?” The tool calculates the change in deaths, years of life shortening and disability, and costs due to changes in air pollution, physical activity, and traffic injuries associated with changes in active transportation levels (i.e., walking and cycling) on a population level.

This tool is a new, web-based version of the California Integrated Transport and Health Impact Model (ITHIM). In California, ITHIM has been used to assess the health impacts of regional transportation plans, goals of state and local agencies, and city and regional transportation projects. The Healthy Mobility Options Tool is the result of a collaboration between the California Air Resources Board (CARB) and California Department of Public Health (CDPH), with web development provided by UC Davis, that transforms the previous, spreadsheet-based version of California ITHIM into a new, user-friendly web-based platform.

This has important implications. Current planning tends to overlook or undervalue many of the health risks caused by policies and planning decisions that increase automobile travel, and the many health benefits provided by more multi-modal transportation planning, and from creating more compact, walkable neighborhoods. This tool not only quantifies these impacts, it also monetizes them, allowing decision-makers to compare them with other benefits and costs, such as travel time savings.

A free webinar introducing the this tool will take place on Monday, December 7, 2020 from 9:00 - 9:30 a.m. Pacific Time Zone. This webinar is oriented towards organizational leaders, planners, and policy-oriented staff whose work is related to health and transportation. Participants will learn what the tool is and examples of use cases. There will be a short live demo of the tool, including the equity modules that give income-level and race-specific results. Participants will be able to better identify the appropriate users in their organization and provide them with information on the tool. 

Wednesday, November 25, 2020 in Integrated Transport and Health Impact Model
Young Professional

I love the variety of courses, many practical, and all richly illustrated. They have inspired many ideas that I've applied in practice, and in my own teaching. Mary G., Urban and Environmental Planner

I love the variety of courses, many practical, and all richly illustrated. They have inspired many ideas that I've applied in practice, and in my own teaching.

Mary G., Urban and Environmental Planner

Get top-rated, practical training for planners

"Planetizen federal action tracker" logo superimposed over black and white image of US Capitol dome.

Planetizen Federal Action Tracker

A weekly monitor of how Trump’s orders and actions are impacting planners and planning in America.

52 minutes ago - Zachary Whalen

Overlapping highways

The state-sanctioned urbicide of Austin

People don’t kill cities. Freeways do.

September 8, 2026 - Benjamin Schneider

The Hoover Dam blocking the Colorado River. The river's water level is noticeably low. The cliffs surrounding the blue water are brown and jagged.

US to reduce Colorado River water deliveries to Mexico

A new Colorado Treaty amendment reduces Mexico’s Colorado River water allocation by 250,000 acre feet.

September 11, 2026 - The Arizona Republic

NYC Mayor Zohran Mandami speaks behind a blue podium.

Mamdani overhauls NYC's Vision Zero plan with 100 new policy goals

The overhaul aims to reduce traffic deaths and make streets safer for pedestrians, cyclists and drivers through lower speed limits, new safety infrastructure and more.
45 minutes ago - ABC 7 Eyewitness News

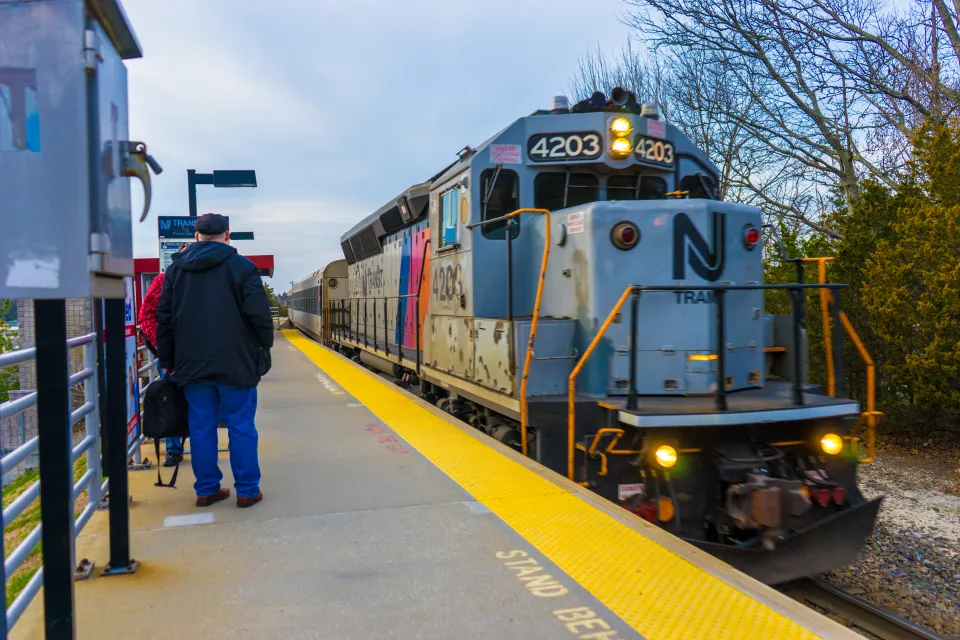
A New Jersey train approaches people waiting at the station.

Amtrak not solely to blame for New Jersey commuter rail's unreliability, report finds

A new study from the Garden State Initiative found that NJ Transit’s budget grew 20% across a 4 year period, but reliability declined significantly over the same period.

September 15 - Mass Transit

A tall, gray power plant billows smoke into a blue sky.

EPA erases limits on planet-warming pollution from power plants

Under Monday’s plan, power plants would still have some limits on how much mercury, arsenic and other contaminants they can emit.

September 15 - New York Times

FREE Course: Walkable City 1: Why Walkability?

After describing his path towards focusing on walkability as the essence of good planning, Jeff Speck marches through his five principal reasons for making more walkable places.

Reinventing Malls: Planning Alchemy—Turning Gray Fields Into Gold

The course focuses on the opportunities and imperatives that shape reinvention of mall sites.