


Reports of New York's gentrification are sometimes exaggerated.

The New York City’s Comptroller’s Office recently put out a report with a treasure trove of data about New York City neighborhoods. Some press coverage of the report focused on gentrification. For example, CityLab headlines one article, "The Gentrification of Gotham," and suggests that the decline of black population in some neighborhoods "suggests not everyone shares in a neighborhood’s economic success." Obviously, such rhetoric conveys a simple message: gentrification is everywhere and gentrification is bad.
But three of New York's five boroughs actually de-gentrified. If (like the CityLab article) you prefer to measure gentrification by race, the Bronx lost 30 percent of its white population between 2000 and 2015, while gaining blacks and Hispanics. Similarly, in Staten Island the number of whites decreased while the number of blacks and Hispanics decreased, and Queens gained Hispanics while losing both whites and blacks.
If you prefer to measure gentrification by income, the results are similar. In the Bronx, the number of people earning less than $25,000 increased by 30 percent, while the number earning over $75,000 decreased. In Staten Island, the former number increased by 25 percent while the latter number again decreased. In Queens, the number earning over $75,000 increased by 12 percent—but the number of persons earning less than $25,000 increased by a greater amount (19 percent). In sum, three of the five boroughs have become browner and poorer since 2000.
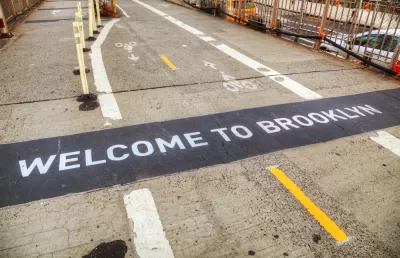
So at most, the CityLab article should have been titled "The Gentrification of Manhattan and Brooklyn." And in those boroughs, there are a few neighborhoods that fit the popular stereotype of gentrification: increased white population, decreased black and Hispanic population, increased rich population, reduced poor population. For example, in Greenpoint/Williamburg, the number of whites increased by 41 percent and the numbers of both blacks and Hispanics decreased. The number of people earning over $75,000 (adjusted for inflation) increased by 363 percent, while the number of people earning under $25,000 (again, adjusted for inflation) decreased. In Brooklyn Heights/Fort Greene, the Lower East Side, Bushwick, and Park Slope, the white population increased while the black/Hispanic population decreased.
But how common was this scenario? Not very. In fact, several Brooklyn neighborhoods (mostly those furthest from Manhattan) experienced the classic "white flight" scenario: fewer whites, more blacks and Hispanics. In East New York/Starrett City, the number of whites decreased by 43 percent between 2000 and 2015, while the black and Hispanic populations increased. Similarly, in Canarsie the white population decreased by 29 percent while the Hispanic and black populations increased by 24 and 40 percent respectively. In Bay Ridge/Dyker Heights, the white population nosedived by 20 percent, while the Hispanic population increased by 53 percent and the black population by 12 percent. In Bensonhurst/Bath Beach, the white population declined by 31 percent while the black and Hispanic populations more than doubled. In Boro Park/Kensington, the white population decreased slightly and the black population increased slightly. In all of these neighborhoods, the low income population increased (and in Boro Park, the high-income population actually decreased).
Moreover, even some affluent parts of Manhattan became more somewhat more diverse. My own Murray Hill/Gramercy and the Upper West Side are still affluent white neighborhoods, but the white population decreased, while the black and/or Hispanic populations increased. And in both places, the number of people earning under $25,000 increased.
And some neighborhoods don’t fit either the "gentrification" narrative or the "white flight" narrative. One common pattern was the "Hispanic growth" pattern, exemplified by Sheepshead Bay. There, the number of both whites and blacks went down, while the Hispanic population increased 111 percent. In Brighton Beach, East Flatbush, Crown Heights, Bedford-Stuyvestant, and Midwood, the white population went up and the black population went down—but the Hispanic population increased. In all but one of these areas (East Flatbush) the number of persons earning under $25,000 increased (although the number of higher income persons increased as well). In Manhattan, Central Harlem experienced both huge white growth and huge Hispanic growth (an increase of over 80 percent).
A few neighborhoods don’t fit any of these narratives. In Brownsville, the populations of all racial groups increased. But the number of low-income persons increased more rapidly than the number of persons earning over $75.000. Similarly, in Sunset Park, East Harlem and Washington Heights, the white population increased while the Hispanic and black populations decreased—but the number of low-income earners increased as well.
Finally, all of the above should be put in perspective: even Manhattan and Brooklyn are far more diverse than most suburbs. Manhattan is 48 percent non-Hispanic white and Brooklyn is 1/3 white, while suburban Suffolk County is 71 percent white.

Census Data: Black Americans Leaving Cities for Suburbs
The trend of Black Americans leaving urban areas for suburban communities mirrors the White Flight of the mid-20th century but for vastly different reasons and with vastly different consequences.
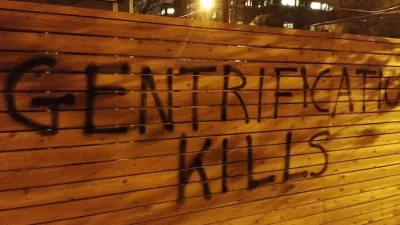
What We Really Mean When We Say Gentrification
The focus on gentrifying communities has, in many cases, eclipsed the similar problems facing more stagnant neighborhoods.

Columnist: New York City Needs Economic Recovery Strategies Other Than Gentrification
It's a tale of two cities as New York starts to emerge from the pandemic.

Maui's Vacation Rental Debate Turns Ugly
Verbal attacks, misinformation campaigns and fistfights plague a high-stakes debate to convert thousands of vacation rentals into long-term housing.

Planetizen Federal Action Tracker
A weekly monitor of how Trump’s orders and actions are impacting planners and planning in America.

Chicago’s Ghost Rails
Just beneath the surface of the modern city lie the remnants of its expansive early 20th-century streetcar system.
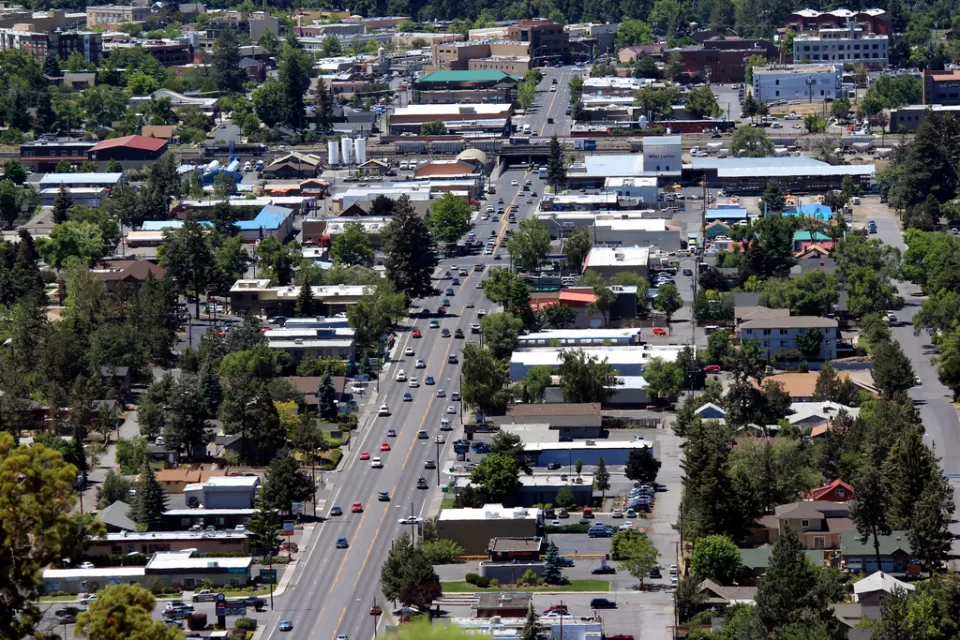
Bend, Oregon Zoning Reforms Prioritize Small-Scale Housing
The city altered its zoning code to allow multi-family housing and eliminated parking mandates citywide.

Amtrak Cutting Jobs, Funding to High-Speed Rail
The agency plans to cut 10 percent of its workforce and has confirmed it will not fund new high-speed rail projects.

LA Denies Basic Services to Unhoused Residents
The city has repeatedly failed to respond to requests for trash pickup at encampment sites, and eliminated a program that provided mobile showers and toilets.
Urban Design for Planners 1: Software Tools
This six-course series explores essential urban design concepts using open source software and equips planners with the tools they need to participate fully in the urban design process.
Planning for Universal Design
Learn the tools for implementing Universal Design in planning regulations.
planning NEXT
Appalachian Highlands Housing Partners
Mpact (founded as Rail~Volution)
City of Camden Redevelopment Agency
City of Astoria
City of Portland
City of Laramie