


Digging into the data to get beyond the misleading notion of radical change in development patterns.


Incorporated in 1977, Apple is now the highest valued corporation in history. The public was first introduced to the cell phone in 1983. The Segway was introduced in 2001 with great fanfare. The smart phone debuted less than a decade ago. Some things change fast—particularly those associated with technology—but some things don't change so fast. Some changes can transform life as we know it (like the smart phone), while others fail to deliver on huge expectations (like the Segway).
If one were dining exclusively on a menu of contemporary media headlines over the past few years, they may have presumed that the suburbs were being auctioned off for pennies on the dollar while millennials and empty-nest baby boomers were in bidding wars for downtown condominiums and a burgeoning supply of infill apartments in the urban core. Understanding the nature of how communities and infrastructure change requires a broader perspective—driven by data, not just anecdotes.
Infrastructure, including our inventory of housing and our transportation systems, doesn't change very fast. The cost of these assets and the life over which these investments must be amortized effectively preclude rapid changes. The aspirations of planners and policymakers for a different future have to be bound by how massively fixed infrastructure mitigates the pace of change.
Much of the attention of the planning community, particularly the transportation planning community, has focused on land use and transportation infrastructure systems intended to achieve the objectives of livability and sustainability. The bust of the housing bubble in 2007, rising energy prices, the emergence of communications as a substitute for travel, concerns about health and obesity, and emerging evidence of different interests of the millennial generation have all inspired dramatic speculation regarding the future of development and transportation investment. Respected analysts were predicting the demise of single-family housing and a drastic shrinkage of average household square footage. A renewed interest in core urban residential development—made highly visible by the physical presence of central business district apartment and condominium towers—and the bubbly enthusiasm of media friendly to central business districts has only heightened expectations.
But the data didn't cooperate. Yes, things are changing, but the increments of change are very small and their consequence in the context of the totality of transportation and land use infrastructure is almost de minimis. Figure 1 below plots housing unit permit activity in the United States since 1980 by number of dwelling units per structure. The figure reveals the dramatic drop off in construction after 2005 and its relatively muted recovery since then. Of more interest is the comparison of both the number and share of single-family homes versus the number of units in structures with five or more units. The Burgundy line (the right-hand axis label) indicates that single-family homes have constituted between 60 and 80 percent of the new units almost continuously since 1980. The most recent data suggests continued softening in the share of single-family homes, but these changes are far from dramatic.
Figure 1 – U.S. Dwelling Unit Permit Trends by Dwelling Units per Structure
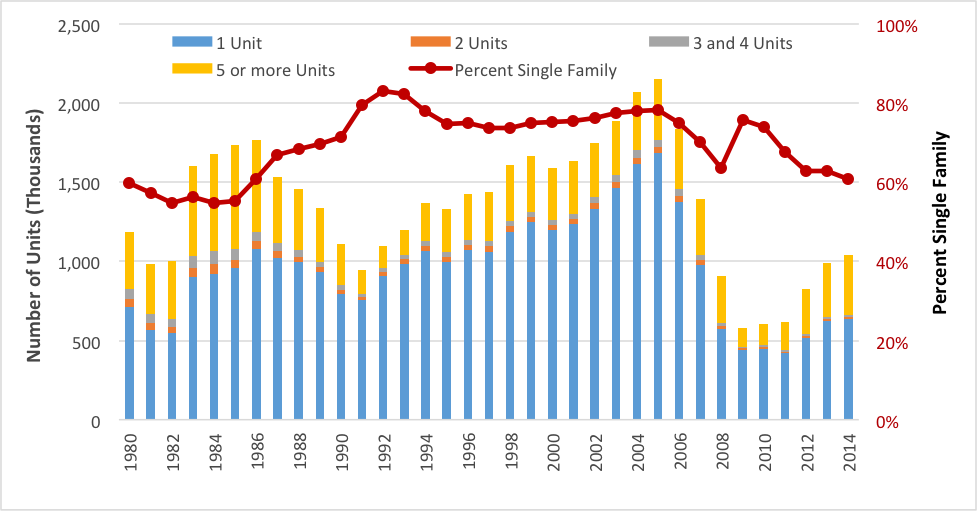
Single-family homes are of interest because historically single-family homes make it difficult to have the dense activity pattern that are more easily able to be served with adequate public transportation and sufficiently dense activity distributions to enable bikable and walkable communities. Obviously there are single-family homes located in areas with great multimodal access, but it is mathematically more challenging to accommodate population in single-family homes while still offering the livability and sustainability benefits planners often seek. Of course, aggregate national trends also don't tell the whole story. Issues such as occupancy levels, structure size, lot size, and the proximity of structures to activity clusters (as well as whether developments are infill, replacement, or greenfield developments) can all influence how competitive various mobility options to serve these units can be.
To add further context, the data in Figure 1 should be put in perspective with the total dwelling unit inventory in the country. Figure 2 shows the housing unit inventory by dwelling units per structure for occupied units based on the American Community Survey. The United States had almost 133 million housing units in 2013. Of these, nearly 90 million, or 71 percent, were single-family units. Thus, the current rate of 1 million new units per year is under 1 percent of the housing stock. That number is close to the rate of population growth (also estimated to be less than 1 percent per year) but leaves no room to offset demolished units—thus, dwelling unit growth and replacement is not keeping up with population growth. Absorption of vacant inventory and changes in average number of residents per dwelling unit been accommodating population growth.
Figure 2 – U.S. Housing Unit Inventory by Dwelling Units per Structure
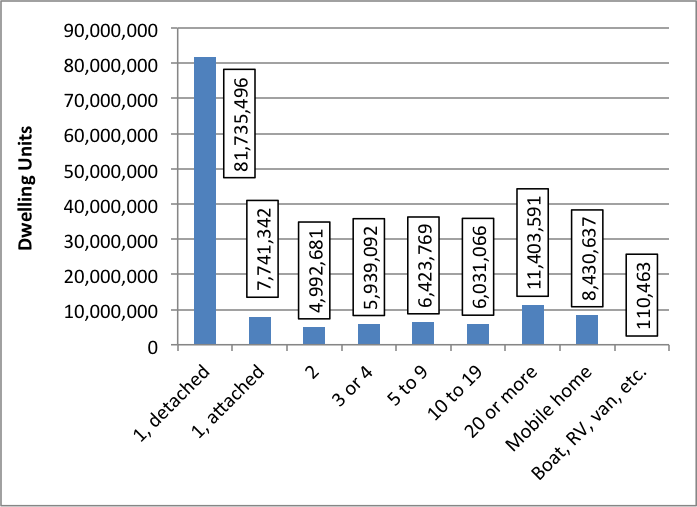
Perhaps most significant in the comparison of these numbers is the fact that the tiny incremental contribution of new construction has only a slightly lower share of single-family units (61 percent) than the average existing inventory (71 percent). At that pace of change it would be decades before there was any discernible change in the overall housing inventory composition. Even if zero net new single-family homes were built going forward, the share of single-family homes among the total residential inventory would only decline by about 10 share points per decade.
The substantial existing inventory of residential structures and the inventory of structures devoted to other uses, from retail to education to health care to employment, highly influence our transportation needs and the nature of economically viable transportation infrastructure and services. New technologies, new business models, innovative strategies, and great planning can all help in providing high-quality mobility while mitigating the negative externalities of travel, but it's important to acknowledge that the huge inventory of fixed land use infrastructure isn't going to change very fast.


What’s in a Name? Investors vs. Speculators
We don’t often make a clear distinction between investors and speculators, which makes it harder to identify harmful behavior — and to find solutions for it.

Single-Family Home Prices Cool, Rents Continue to Rise
Despite a slowdown in the single-family market, record-high rents show no signs of dropping.

Local, State Governments Creating Obstacles for Institutional Investors on the Housing Market
Large Wall Street investors are increasing their footprint in the housing market, like they did after the Great Recession, and some local and state governments are inventing new ways to prevent these institutional investors from cornering the market.

Maui's Vacation Rental Debate Turns Ugly
Verbal attacks, misinformation campaigns and fistfights plague a high-stakes debate to convert thousands of vacation rentals into long-term housing.

Planetizen Federal Action Tracker
A weekly monitor of how Trump’s orders and actions are impacting planners and planning in America.

San Francisco Suspends Traffic Calming Amidst Record Deaths
Citing “a challenging fiscal landscape,” the city will cease the program on the heels of 42 traffic deaths, including 24 pedestrians.

Defunct Pittsburgh Power Plant to Become Residential Tower
A decommissioned steam heat plant will be redeveloped into almost 100 affordable housing units.

Trump Prompts Restructuring of Transportation Research Board in “Unprecedented Overreach”
The TRB has eliminated more than half of its committees including those focused on climate, equity, and cities.

Amtrak Rolls Out New Orleans to Alabama “Mardi Gras” Train
The new service will operate morning and evening departures between Mobile and New Orleans.
Urban Design for Planners 1: Software Tools
This six-course series explores essential urban design concepts using open source software and equips planners with the tools they need to participate fully in the urban design process.
Planning for Universal Design
Learn the tools for implementing Universal Design in planning regulations.
Heyer Gruel & Associates PA
JM Goldson LLC
Custer County Colorado
City of Camden Redevelopment Agency
City of Astoria
Transportation Research & Education Center (TREC) at Portland State University
Jefferson Parish Government
Camden Redevelopment Agency
City of Claremont