


Conventional evaluation often exaggerates congestion costs by using baseline travel speeds which exceed speed limits. This assumes that traffic speed compliance is a congestion cost that justifies major infrastructure investments to alleviate.


I will be speaking about ways to identify truly optimal solutions to traffic congestion at the Solving Gridlock Forum next Monday in Toronto. In preparation I updated my report, Smart Congestion Relief: Comprehensive Evaluation Of Traffic Congestion Costs and Congestion Reduction Strategies which provides detailed discussion of the methods used to measure congestion problems and select the best combination of solutions.
This is a timely issue. New data from services such as TomTom and INRIX provide more information on where and when roads are congested. Their goal is to convince motorists to purchase their services so their message highlights the severity of congestion problems. Their information is certainly useful for making short-term travel decisions, such as whether and how to travel across town during rush hour, but it is not appropriate for evaluating strategic planning decisions which affect the quality of alternative modes or land use planning decisions, as discussed in my previous column, Smarter Congestion Solutions in 2014.
Comprehensive congestion cost data is needed for strategic planning since many planning decisions involve trade-offs between congestion and other forms of access. For example, converting general traffic lanes into bus or bike lanes, or more compact land use development, may increase congestion intensity, but by improving alternative modes and reducing the distances people must drive to reach destinations, may reduce total per capita congestion costs. Indicators such as roadway level-of-service and the Travel Time Index only indicate congestion intensity, not costs, and so undervalue improvements to non-auto modes and smart growth development policies.
My research indicates that conventional evaluation tends to be biased in ways that exaggerate congestion costs and roadway expansion benefits, and undervalue other congestion solutions. My revised report examines these factors in detail. Let me describe one example.
A key factor in congestion cost analysis is how baselines speeds (the speeds below which congestion delays are calculated) are measured. In the past they were often based on the legal speed limits of each road link, but studies such as the Urban Mobility Report (UMR) now use INRIX data which measure actual freeflow speeds (traffic speeds under uncongested conditions). This may seem like a data accuracy improvement, but freeflow speeds often exceed legal speed limits, which raises an interesting question: Should traffic speed compliance (i.e., reducing traffic speeds to the legal limit) be considered a “cost” which justifies major infrastructure investments to alleviate?
My analysis indicates that a significant portion of estimated congestion costs consist of speed limit compliance. For example, the UMR’s Exhibit A-8 shows that their analysis used a 64.6 mph freeflow baseline speed on Los Angeles freeways, although the speed limits there are 55 mph, indicating that about 60% of that city’s estimated congestion “cost” consists of legal speed limit compliance. Similarly, it used a 64.0 mph baseline in Miami, although the speed limit there is 60 mph, so 55% of the estimated congestion “cost” is speed limit compliance. Under uncongested conditions, traffic usually exceeds legal speed limits - in fact, speed limits are normally set to reflect the 85th percentile freeflow traffic speeds. Although I lack the data needed to test all roadway links, I suspect that in most cases a significant portion of the UMR’s congestion “costs” reflect legal speed compliance. Assuming that Los Angeles and Miami are the higher range, probably somewhere between a quarter to half of estimated congestion costs represent speed compliance.
I doubt that most people would agree that reducing traffic speeds to legal limits is a problem that justifies expensive infrastructure investments, yet that is what these congestion costing studies imply. Their reports fail to discuss this or other similar analysis assumptions, so most people who use their results have no knowledge of these issues of debate and uncertainty. In fact, most traffic engineers and economists recommend significantly lower baseline speeds, typically level-of-service C or D, since that tends to optimize traffic throughput and vehicle fuel efficiency, and is more likely to reflect what motorists are actually willing to pay for marginal increases in traffic speeds.
This is one of several ways that commonly-used traffic evaluation methods can exaggerate congestion costs. The Urban Mobility Report’s estimate that U.S. congestion costs total $121 billion was calculated using freeflow baseline speeds, relatively high travel time values, and optimistic assumptions of fuel savings, emission reductions and safety impacts. It therefore represents an upper-bound value; more realistic assumptions result in much lower congestion cost estimates.
Sensitivity Analysis of Urban Mobility Report Congestion Cost Estimates
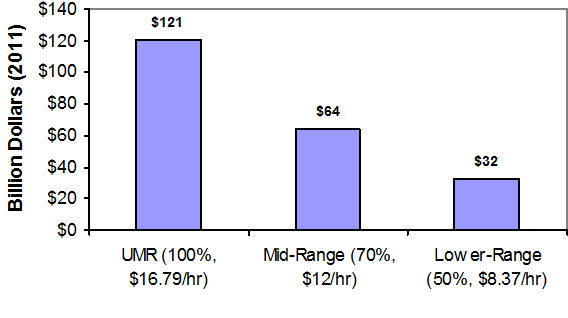
The Urban Mobility Report’s $121 billion cost estimate is based on higher baseline speeds and travel time unit costs than most experts recommend. The lower-range estimate in this graph is based on 50% of baseline speed and the U.S. Department of Transportation’s lower travel time unit costs, reflecting reasonable lower-bound values.
I am not suggesting that traffic congestion is costless and can be ignored, but it is important to put it into perspective: traffic congestion is a moderate transportation cost overall, larger than some but smaller than others, so it is important to consider all impacts when evaluating potential congestion reduction strategies. It would not generally be efficient to implement a strategy that significantly increases other costs, such as vehicle expenses or accidents, but a strategy may be far more beneficial overall if it helps achieve other planning objectives such as reducing parking problems or improving mobility for non-drivers. More comprehensive evaluation helps identify truly optimal congestion reduction strategies, considering all these impacts.
Congestion Compared With Other Transportation Costs
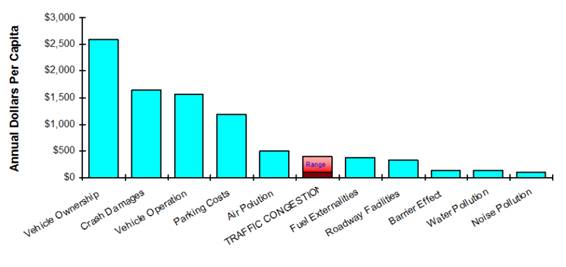
Congestion costs are estimated to range between $110 and $390 annually per capita, depending on assumptions. Even the highest estimate is moderate compared with other transport costs.
My conference presentation will explore these issues and discuss examples of win-win congestion reduction strategies that help achieve multiple planning objectives. There are still spaces available if you want to attend.
For More Information
Matthew Barth and Kanok Boriboonsomin (2009), “Traffic Congestion And Greenhouse Gases,” Access 35, University of California Transportation Center.
Alexander York Bigazzi and Miguel Figliozzi (2012), “Congestion And Emissions Mitigation: A Comparison Of Capacity, Demand, And Vehicle Based Strategies,” Transportation Research Part D: Transport and Environment, Vol. 17, pp. 538-547.
Eric Dumbaugh (2012), “Rethinking the Economics of Traffic Congestion,” Atlantic Cities, 1 June 2012.
Susan Grant-Muller and James Laird (2007), International Literature Review of the Costs of Road Traffic Congestion, Scottish Executive.
Todd Litman (2001), “Generated Traffic; Implications for Transport Planning,” ITE Journal, Vol. 71, No. 4, April, pp. 38-47.
Todd Litman (2013), “Smarter Congestion Relief In Asian Cities: Win-Win Solutions To Urban Transport Problems,” Transport and Communications Bulletin for Asia and the Pacific, No. 82.
Todd Litman (2014), Smart Congestion Relief: Comprehensive Evaluation Of Traffic Congestion Costs and Congestion Reduction Strategies, Victoria Transport Policy Institute.
Todd Litman (2014), Congestion Costing Critique: Critical Evaluation of the ‘Urban Mobility Report,’ Victoria Transport Policy Institute.
Todd Litman (2014), The Mobility-Productivity Paradox: Exploring The Negative Relationships Between Mobility and Economic Productivity, presented at the International Transportation Economic Development Conference.
TC (2006), The Cost Of Urban Congestion In Canada, Transport Canada.
TTI (2012), Urban Mobility Report, Texas Transportation Institute.
Ian Wallis and David Lupton (2013), The Costs Of Congestion Reappraised, Report 489, New Zealand Transport Agency.

Threats of Gridlock are Greatly Exaggerated
A few weeks ago the Texas Transportation Institute (TTI) released its latest Urban Mobility Report, and yesterday INRIX released its National Traffic Scorecard 2010 Annual Report. Both paint a grim picture of roadway conditions. “America is back on the road to gridlock,” warns INRIX.

Conservatives’ Decongestion Pricing Flip-Flop
When it comes to solving traffic problems, the current federal administration is on track for failure, waste, and hypocrisy.

Why Traffic Never Gets Better
Despite abundant research showing that roadway expansions provide limited congestion relief and increase long-term traffic problems, they still occur due to wishful thinking: advocates claim that “this” project is different.

Planetizen Federal Action Tracker
A weekly monitor of how Trump’s orders and actions are impacting planners and planning in America.

Chicago’s Ghost Rails
Just beneath the surface of the modern city lie the remnants of its expansive early 20th-century streetcar system.

Amtrak Cutting Jobs, Funding to High-Speed Rail
The agency plans to cut 10 percent of its workforce and has confirmed it will not fund new high-speed rail projects.

Ohio Forces Data Centers to Prepay for Power
Utilities are calling on states to hold data center operators responsible for new energy demands to prevent leaving consumers on the hook for their bills.

MARTA CEO Steps Down Amid Citizenship Concerns
MARTA’s board announced Thursday that its chief, who is from Canada, is resigning due to questions about his immigration status.

Silicon Valley ‘Bike Superhighway’ Awarded $14M State Grant
A Caltrans grant brings the 10-mile Central Bikeway project connecting Santa Clara and East San Jose closer to fruition.
Urban Design for Planners 1: Software Tools
This six-course series explores essential urban design concepts using open source software and equips planners with the tools they need to participate fully in the urban design process.
Planning for Universal Design
Learn the tools for implementing Universal Design in planning regulations.
Caltrans
City of Fort Worth
Mpact (founded as Rail~Volution)
City of Camden Redevelopment Agency
City of Astoria
City of Portland
City of Laramie