


Two former Mozilla engineers strive to merge big data with a 3D model of London and, potentially, other cities.

There is no shortage of news about numerous apps and visualization tools to facilitate design and presentation in planning. The latest in visualization tools provide a real-life experience of not only the built environment, but also attempts to overlay big data to create an “experience which is immediately intuitive, whether you're my grandma or whether you're the Head of Transport for London, you can come in and use this tool to understand complex data in a real-world environment. One which makes it immediately more tangible than a two-dimensional map, giving you more context, which makes it easier to make decisions based on all that data.”
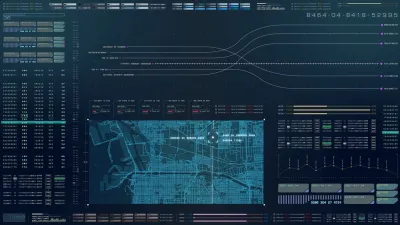
Michael Grothaus reports on two former Mozilla engineers Robin Hawkes and Peter Smart who are working on a SimCity-esque 3D model of London. Hawkes and Smart mash OpenStreetMap with big data that are publicly accessible, but not often used or even understood by the average person. ViziCities attempts to present big data (ranging from government demographics to Twitter feeds) in a manner that can be visually and even audibly experienced in a simulated 3D world. While ViziCities is creating a 3D world of London, Hawkes and Smart plan to offer their codes on GitHub to encourage other developers to create 3D models of their own cities.
FULL STORY: This Former Mozilla Engineer Turned London Into SimCity, With Real Data

Urban Design in the New Soft City
Carl Skelton argues that the public needs new tools of citizenship to participate fully in the digital cities of the near future.
How Data-Driven Research Is Shaping Sustainable Urban Development
Explore how data-driven research is revolutionizing sustainable urban development, creating smarter, greener, and more resilient cities for the future.

Hoboken's Curbs Are Going Digital
Hoboken, New Jersey, is leveraging technology to up its curb management game with a digital streetscape map that will allow real-time demand monitoring.

Maui's Vacation Rental Debate Turns Ugly
Verbal attacks, misinformation campaigns and fistfights plague a high-stakes debate to convert thousands of vacation rentals into long-term housing.

Planetizen Federal Action Tracker
A weekly monitor of how Trump’s orders and actions are impacting planners and planning in America.

Chicago’s Ghost Rails
Just beneath the surface of the modern city lie the remnants of its expansive early 20th-century streetcar system.

Bend, Oregon Zoning Reforms Prioritize Small-Scale Housing
The city altered its zoning code to allow multi-family housing and eliminated parking mandates citywide.

Amtrak Cutting Jobs, Funding to High-Speed Rail
The agency plans to cut 10 percent of its workforce and has confirmed it will not fund new high-speed rail projects.

LA Denies Basic Services to Unhoused Residents
The city has repeatedly failed to respond to requests for trash pickup at encampment sites, and eliminated a program that provided mobile showers and toilets.
Urban Design for Planners 1: Software Tools
This six-course series explores essential urban design concepts using open source software and equips planners with the tools they need to participate fully in the urban design process.
Planning for Universal Design
Learn the tools for implementing Universal Design in planning regulations.
planning NEXT
Appalachian Highlands Housing Partners
Mpact (founded as Rail~Volution)
City of Camden Redevelopment Agency
City of Astoria
City of Portland
City of Laramie