


A Detroit-based maker of "crowdfunding and social mapping systems," has developed an interactive map of the tax status of every property in Detroit. In bright yellows, oranges, and reds, the city's property tax "black hole" is brutally clear.
John Metcalfe discusses the "Why Don't We Own This?" map created by LOVELAND Technologies, with the intent of providing "property information in a clean and interactive way that is intuitive to use while increasing the sense of ownership and power a citizen has in their city."
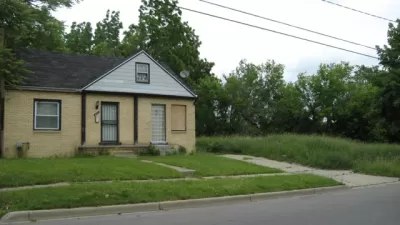
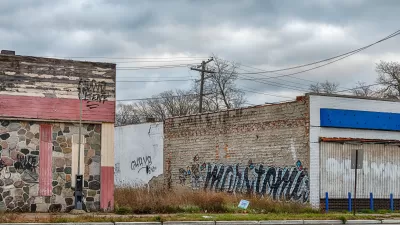
"What looks like a big hunk of moldy cheese is in fact the property-tax status of [384,861] properties, as logged by Wayne County's online tax portal," writes Metcalfe. Bright yellows, oranges, and reds show the 151,607 properties that are either tax-distressed, subject to foreclosure, or already foreclosed.
No wonder Wayne County’s record high tax auctions have attracted interest from investors "from around the U.S. and as far away as England, Cambodia, China and Australia."
"On the full, interactive version, you can zoom down to the level of streets to see who's behind on their payments on your block. Then, when you've selected an individual property, the map offers several ways to balance the tax debt – paying the fees online, for instance, or seeking a poverty exemption or financial assistance from grant-giving institutions. That means this bit of urban cartography isn't just neat to look at, but might help repay a little of the $444 million in taxes and penalties owed around Detroit."
FULL STORY: Detroit's Property Tax Black Hole, in Map Form

How Risky Lending Hollowed Out Detroit
Over one half of Detroit's foreclosed homes are blighted or abandoned. Buyers who purchased the homes for as little as $1 have little incentive to keep them in good shape—or pay taxes.
Detroit Says Problems With Property Tax Assessments are Fixed. Advocates Disagree.
With higher-valued properties under assessed and lower-valued properties over assessed, advocates say there's still a problem with Detroit's property tax system.
Proposed Land Value Tax Plan in Detroit
Detroit Mayor Mike Duggan proposes hiking property taxes for vacant land and buildings while lowering the rate for occupied homes and businesses in a split tax plan he contends will resolve many of Detroit's blight and high property tax woes.

Maui's Vacation Rental Debate Turns Ugly
Verbal attacks, misinformation campaigns and fistfights plague a high-stakes debate to convert thousands of vacation rentals into long-term housing.

Planetizen Federal Action Tracker
A weekly monitor of how Trump’s orders and actions are impacting planners and planning in America.

In Urban Planning, AI Prompting Could be the New Design Thinking
Creativity has long been key to great urban design. What if we see AI as our new creative partner?

King County Supportive Housing Program Offers Hope for Unhoused Residents
The county is taking a ‘Housing First’ approach that prioritizes getting people into housing, then offering wraparound supportive services.

Researchers Use AI to Get Clearer Picture of US Housing
Analysts are using artificial intelligence to supercharge their research by allowing them to comb through data faster. Though these AI tools can be error prone, they save time and housing researchers are optimistic about the future.

Making Shared Micromobility More Inclusive
Cities and shared mobility system operators can do more to include people with disabilities in planning and operations, per a new report.
Urban Design for Planners 1: Software Tools
This six-course series explores essential urban design concepts using open source software and equips planners with the tools they need to participate fully in the urban design process.
Planning for Universal Design
Learn the tools for implementing Universal Design in planning regulations.
planning NEXT
Appalachian Highlands Housing Partners
Mpact (founded as Rail~Volution)
City of Camden Redevelopment Agency
City of Astoria
City of Portland
City of Laramie