


There is evidence that automobile travel is peaking while demand for non-auto modes is growing, but double-check your data sources to be sure.

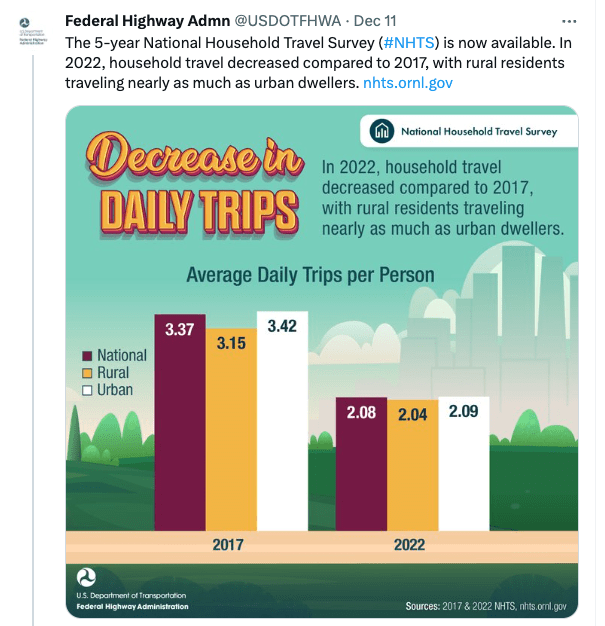
The National Household Travel Survey (NHTS) is a detailed study of travel activity sponsored by the U.S. Department of Transportation. Results of the 2022 version were recently released, including the following graph which shows a huge (38%!) decline in average trips per capita by all modes.
This was cited as proof of peak car and an overall decline in out-of-home activities in Angie Schmitt’s recent article, Nobody's Leaving the House Anymore.
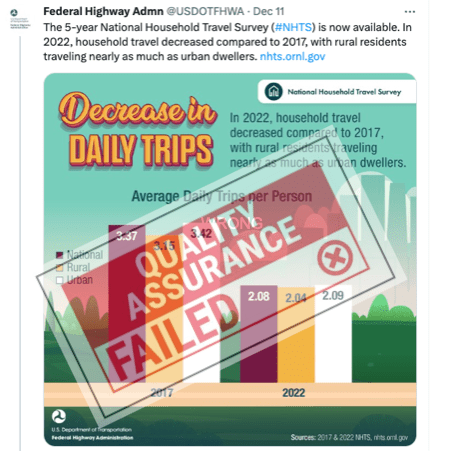
However, as Joe Cortright points out in Bad Data: Not a Decline in Travel, this probably reflects major changes in the survey methodology (previous versions relied on a travel diary in which participants recorded their travel activity when it happened, the 2022 version had them recall trips they made the previous day, a much less reliable method) rather than actual changes in travel activity. Joe provided the following image.
However, other, more reliable data sources also indicate that per capita automobile travel is peaking while demand for other modes is increasing, as discussed in my report, The Future Isn't What It Used to Be: Changing Trends and Their Implications for Transport Planning. This reflects a combination of factors including vehicle travel saturation, aging population, rising fuel prices, increased urbanization, changing consumer preferences, improved accessibility options (such as telework, work-at-home and e-bikes) and more multimodal transportation. Automobile travel will not disappear, but it indicates that many people would prefer to spend less time and money on driving, and rely more on walking, bicycling and public transportation, provided they are convenient, comfortable and affordable.
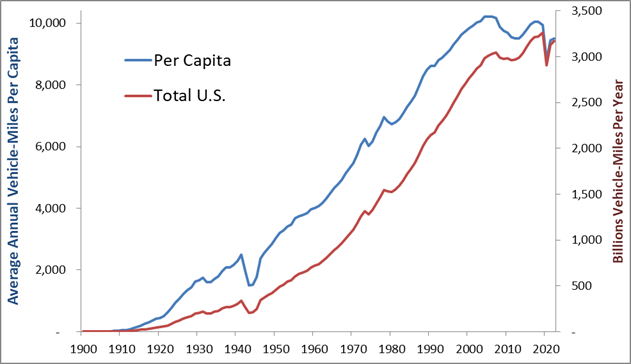
In fact, per capita vehicle travel peaked in the US in 2006 and has declined somewhat since, as illustrated in the following graph.
U.S. Annual Vehicle Travel (FHWA)
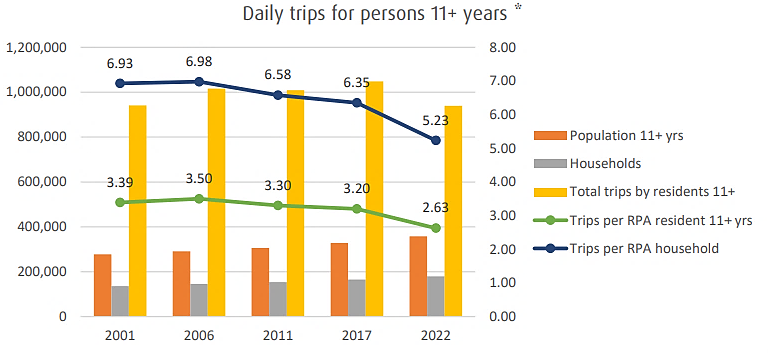
Our regional travel surveys here on Southern Vancouver Island shows similar trends. Per capita automobile travel peaked about 2006 and subsequently declined, particularly in communities that improved non-auto travel options. Similar reductions are occurring in other North American communities.
This is good news overall. It indicates that given better options travelers will drive less and rely more on non-auto modes, helping to achieve sustainable transportation goals including local economic development, increased affordability, improved public fitness and health, and environmental protection.


Generation Z Is Driving Less, But History Indicates It Won’t Last
Think Generation Z will usher in the long-awaited post-car future of transit advocates’ dreams? Think again (about the example set by the Millennials).

Smart Growth and Vehicle Travel Reductions
Many jurisdictions have vehicle travel reduction targets. Integrated Smart Growth policies can help achieve these and other planning goals.

Gas Prices and Vehicle Miles Traveled Analyzed Since 2000
Urban economist Joe Cortright examines the connection between gas prices and driving in the U.S. over the last two decades. Prices matter: increased gas prices results in decreased driving, providing the prices persist for the long-term.

Planetizen Federal Action Tracker
A weekly monitor of how Trump’s orders and actions are impacting planners and planning in America.
Silicon Valley ‘Bike Superhighway’ Awarded $14M State Grant
A Caltrans grant brings the 10-mile Central Bikeway project connecting Santa Clara and East San Jose closer to fruition.

Amtrak Cutting Jobs, Funding to High-Speed Rail
The agency plans to cut 10 percent of its workforce and has confirmed it will not fund new high-speed rail projects.

Planting for Change: How Trees Are Powering Climate Action
"Combating Climate Change with Trees" highlights how Southern California communities are strategically planting and nurturing urban forests to cool neighborhoods, improve air quality, and advance environmental justice.

Could Planners Adopt a 'Place Sherpa' Role?
Building upon the framework of a local housing panel, Chuck Wolfe suggests that advocacy and policy discussions would be enhanced by a “sherpa mindset” that focuses on lived experiences, facilitates applied knowledge of urban places, and promotes stakeholder discussion.

California Advances Its 30x30 Conservation Goals
California is making significant progress toward its 30x30 conservation goals, but looming federal rollbacks and gaps in biodiversity protections could threaten the state’s efforts to protect lands and coastal waters by 2030.
Urban Design for Planners 1: Software Tools
This six-course series explores essential urban design concepts using open source software and equips planners with the tools they need to participate fully in the urban design process.
Planning for Universal Design
Learn the tools for implementing Universal Design in planning regulations.
Caltrans
City of Fort Worth
Mpact (founded as Rail~Volution)
City of Camden Redevelopment Agency
City of Astoria
City of Portland
City of Laramie