


In an excerpt from his new book, Anthony Townsend explains how a volunteer effort is combining consumer technologies with open source GIS to chart one of Africa’s largest and most notorious slums.

In 2008, the world became mostly urban, when for the first time, more people lived in cities than rural areas. That year, we also crossed an important technological threshold – for the first time there were more mobile broadband Internet subscribers than fixed. A new book by Anthony Townsend, SMART CITIES: Big Data, Civic Hackers, and the Quest for a New Utopia, explores the intersection of these historic shifts. With the UN projecting that 90 percent of population growth in coming decades will occur in cities throughout the developing world, new solutions are needed to address the rapid expansion of informal settlements. In this excerpt, Townsend explains how a new volunteer effort Map Kibera is combining consumer technologies and open source GIS to chart one of Africa’s largest and most notorious slums.
Once upon a time, pedestrians in American and European cities lived in fear of airborne feces: before modern sanitation was introduced, the cry of “Gardez l’eau” (literally “Look out for the water!”) would herald the evacuation of one’s chamber pot into the street. As cities like London boomed during the nineteenth century, every available body of water, from creeks to rivers to ponds, became an open cesspool. Only repeated cholera epidemics, and the “Great Stink” of 1858 (which forced Parliament to soak the curtains of the House of Commons in lime to mask the foul odor of the Thames River) would spur government action.
Today, this ugly practice has reemerged for a whole new generation of city dwellers in the developing world, an ad hoc adaptation to unplanned urban growth and a lack of investment in sanitation. In the Kenyan capital of Nairobi, in place of chamber pots the residents of the massive Kibera slum have put the ubiquitous plastic bag to work. The process is much the same, however. Squat, step to the window, and hurl. Throughout the night, “Scud missiles,” as the locals mockingly dub the flying waste packets, rain down on tin rooftops and hapless pedestrians. Compared to nineteenth-century London, the results are actually quite good. Sealed in their plastic tomb, disease-carrying microbes have a much harder time spreading. Cholera, dispersed through London’s contaminated water supply, killed more than ten thousand people in 1853–54 alone. Kibera has its share of water-borne disease but nothing on that scale.
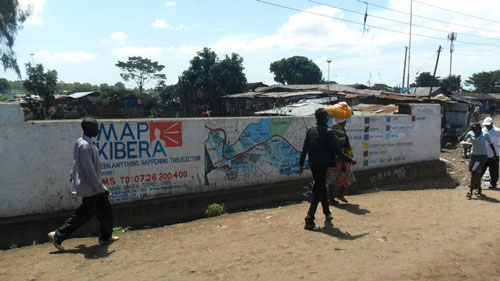
Image courtesy flickr user mapkibera
Home to an estimated 250,000 residents, Kibera is one of Africa’s largest slums. But if you looked it up on Google Maps in 2008 and toggled between the satellite view and street-map view, you could make it disappear. One second it was there, a zoomable patina of corrugated tin shacks amid a rich tapestry of alleys and roads, unable to hide from a camera floating in space. Then it was gone, replaced by a blank spot drawn from a government map that still identified the area as the forest that previously stood there. Kibera’s omission spoke volumes about how officials and the public saw it. Instead of the reality of a quarter-million people striving to build a future with their bare hands, all they knew were the sensational horror stories of Scud missiles.
Slums are often simply invisible to outsiders who lack basic information about who lives there. While Rio de Janeiro’s top-down surveillance raises troubling questions about remote sensing of poor communities, the fact is that slums have much to gain from being documented. Being counted is the most basic act of inclusion—for a slum to assert its rights within the official city surrounding it, it needs to be measured and mapped. Many slum dwellers are taking matters into their own hands and arming themselves with new tools and methods to survey their own communities. Computerized mapping of cities is a half-century-old idea, originally developed by the US military and the census, but the first large-scale efforts to map slums didn’t begin until 1994, in the Indian city of Pune. Led by Shelter Associates, an NGO formed by local architects and planners, “the project was based on the philosophy that poor people are the best people to find solutions to their housing problems,” its founders wrote in the journal Environment & Urbanization. Teaming up with Baandhani, an informal network of women who pool their savings to invest in better housing, the group surveyed slum residents, their homes, and the availability of fuel and electricity. In 2000 the city began funding the effort and in just two years it had surveyed some two-thirds of Pune’s 450 slum settlements, mapping some 130,000 households.
The effort to put Kibera on the map was started by two geeks from the rich world, Erica Hagen and Mikel Maron, who in 2009 joined forces with a trio of Kenyan community-development groups to launch Map Kibera. They recruited a handful of twentysomethings who were active in the community, one from each of the slum’s thirteen villages. With just two days of training in how to use consumer--grade GPS receivers, these volunteer mappers were sent out to traverse Kibera on foot, using their bodies as tools to collect traces of the thousands of streets, alleys, and paths that would form the first-ever digital base map of the thriving community. Results came quickly. “We did the first map in three weeks,” Maron recalls.
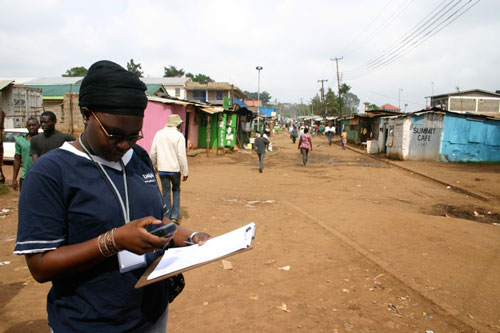
Image courtesy flickr user Erica Hagen
The Indian activists who pioneered slum mapping in the 1990s saw their work as a way to begin integrating poor communities into existing city-planning efforts in the hope of securing a fairer share of government resources. But with the new chart living online in OpenStreetMap, Map Kibera is focused instead on powering new tools that change how the community is represented in the media, and how organizers lobby the government to address local problems. Voice of Kibera, for instance, is a citizen-reporting site built using another open-source tool called Ushahidi. The name means “testimony” in Swahili, and it was developed in 2008 to monitor election violence in Kenya. Voice of Kibera plots media stories about the community onto the open digital map, and allows residents to send in their own reports by SMS. Another Map Kibera effort recruits residents to monitor the progress of infrastructure projects. Government--funded slum upgrades, such as the installation of water pumps and latrines, are hot spots for graft in Kenya. Many of the projects are awarded to friends of parliament members, and the government doesn’t effectively monitor or audit contractors. Using this tool, residents can post reports on the actual state of construction, frequently contradicting the government’s own claims. Over time, slowly but surely, the map is helping shift public perception of Kibera away from flying bags of crap and toward a view of a community of real people. As Maron told me, “People like living in Kibera. What they don’t like is having raw sewage running by their house.”
Map Kibera represents a shift in how we think about using technology to help poor communities. We can ship all of the laptops we want to the world’s slums, but we can’t force anyone to use them, and even if they do we certainly can’t guarantee it will have the intended impact. The United Nations can track all of the weak signals of economic distress from afar through efforts like Global Pulse, but the tools to intervene once a crisis is identified haven’t changed much from yesteryear. Map Kibera demonstrates how open-source tools, put in place on behalf of poor communities, can empower them to create knowledge relevant to the problems they face. As Hagen described Map Kibera in a 2010 article, “It is founded on the premise that the advent of the digital age means that gatekeepers to information and data can often be bypassed or ignored completely, allowing for a new and sometimes parallel information system to be created and used by marginalized citizens.”
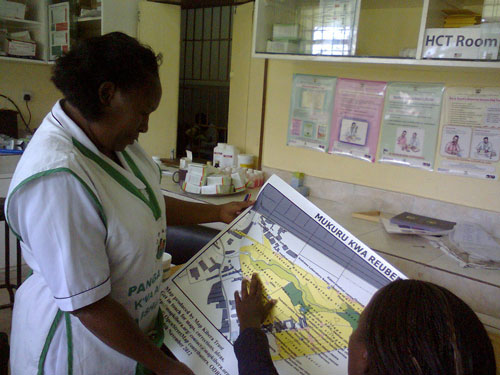
Image courtesy flickr user mapkibera
Since the 1990s, ICT4D projects mostly operated on an approach that Richard Heeks calls “pro-poor.” As he puts it, in projects like One Laptop Per Child, “innovation occurs outside poor communities, but on their behalf.” Truly sustainable solutions require people to participate in a project’s design and implementation. Heeks calls this model “para-poor”: outsiders work alongside members of poor communities in “participative, user-engaged design processes.” As the movement evolves, and technologies like the mobile phone trickle down, Heeks envisions a second shift to “per-poor” innovation, done entirely by and for the poor. While Map Kibera is clearly a para-poor project, with Westerners bringing in new technology and design ideas, it has created a framework on which per-poor innovation can happen.
Mapping has tremendous power to improve the slums of the developing world. John Snow’s map of cholera deaths in 1850s London recast the public understanding of slum conditions, and spurred reforms that eventually rid the city of the disease for good. In India, slum mapping is helping change the practice of city planning, which long considered those communities “chaotic masses rather than coherent urban areas,” according to Shelter Associates. But in both cases, governments responded achingly slowly. Map Kibera offers the hope that by using maps to power community-based initiatives, rather than simply lobby government, progress will be faster.
It’s unconscionable that governments continue to ignore the slums, to pretend that they are invisible. But in sub-Saharan Africa, where the UN estimates that six out of ten people live in slums, with a little help from concerned outsiders slum dwellers are rewriting the map themselves. But it won’t happen on its own. Map Kibera’s lesson is clear—it isn’t enough to simply drop technology into poor communities. Do-gooders will have to stick around long enough to teach people how to use it. “Give a man a fish and you feed him for a day,” the Chinese proverb goes, “teach a man to fish and you feed him for a lifetime.”
Dr. Anthony Townsend is Research Director at the Institute for the Future and Senior Research Fellow at New York University's Rudin Center for Transportation. His first book, Smart Cities: Big Data, Civic Hackers and the Quest for A New Utopia is published by W.W. Norton & Co.


Planetizen Federal Action Tracker
A weekly monitor of how Trump’s orders and actions are impacting planners and planning in America.

Chicago’s Ghost Rails
Just beneath the surface of the modern city lie the remnants of its expansive early 20th-century streetcar system.

Amtrak Cutting Jobs, Funding to High-Speed Rail
The agency plans to cut 10 percent of its workforce and has confirmed it will not fund new high-speed rail projects.

Ohio Forces Data Centers to Prepay for Power
Utilities are calling on states to hold data center operators responsible for new energy demands to prevent leaving consumers on the hook for their bills.

MARTA CEO Steps Down Amid Citizenship Concerns
MARTA’s board announced Thursday that its chief, who is from Canada, is resigning due to questions about his immigration status.

Silicon Valley ‘Bike Superhighway’ Awarded $14M State Grant
A Caltrans grant brings the 10-mile Central Bikeway project connecting Santa Clara and East San Jose closer to fruition.
Urban Design for Planners 1: Software Tools
This six-course series explores essential urban design concepts using open source software and equips planners with the tools they need to participate fully in the urban design process.
Planning for Universal Design
Learn the tools for implementing Universal Design in planning regulations.
Caltrans
City of Fort Worth
Mpact (founded as Rail~Volution)
City of Camden Redevelopment Agency
City of Astoria
City of Portland
City of Laramie