Homicides rose across the nation in 2020 and 2021 but began to ebb in 2022 and 2023. Have these trends played out equally across all cities, or were they worse in cities controlled by one political party or the other?


Editor’s note: This blog was updated on September 19, 2024 to reflect 2023 U.S. crime rate data and trends. Also, check out the author's sequel to the piece, which focuses on red cities, blue cities and property crime.
In 2020, the national homicide rate rose 30 percent. Homicides continued to increase in most cities in 2021, but the tide of violence began to ebb over the last two years.
Naturally, this tragedy has become a political football, and at least two contending narratives have arisen to explain what went wrong. Republican media tend to favor a “bad blue city” narrative. According to this story, crime is the result of progressive permissiveness in Democrat-run cities and states. By contrast, Democratic media tend to claim that crime is a problem everywhere, caused by some mix of COVID-related madness and increased gun purchases. But has urban crime really risen more in Democratic cities? And if so, are all blue cities the same, or are the most progressive cities in America especially problematic?
How do we define a red city vs. a blue city?
The American Violence website contains homicide and shooting data for 90 large and medium-sized cities. It seems that American cities can be divided into multiple groups, beyond even red cities and blue cities:
- Red cities: cities with Republican mayors. These cities include Fresno, Fort Worth, Oklahoma City, Omaha, Tulsa,, Miami, Bakersfield, Stockton, Lexington, and Lubbock (Numerous other mid-sized cities, such as Virginia Beach and Mesa, also have Republican mayors, but I am only counting urban cores, and municipalities such as Mesa are basically suburbs of more traditional cities. Also, the mayor of Dallas recently switched parties so I am still counting him as a Democrat). *
- Dense cities: Cities with unusually high densities and historically high transit ridership (New York, Boston, San Francisco, Chicago, Washington, Philadelphia). These cities tend to have become more left-wing in recent decades.
- Other progressive cities: cities other than the cities in (2) that seem to have a reputation for being somewhat more progressive than most non-red cities. (I haven’t thought of any more precise way of distinguishing progressive cities from moderate ones, but maybe I am missing something here!) My educated guess is that this group includes include Seattle, Portland, Austin, Minneapolis, Oakland, and Los Angeles.
- Black cities: Cities (outside group 2) that are majority Black—Baltimore, Detroit, Memphis, Baton Rouge and Cleveland.. I also include Atlanta in this category, since it is almost half Black and has had Black mayors for half a century. I separated these cities from group 3 because Blacks are not always as socially left-wing as white progressives, so I thought it was possible that these cities might have different results than those in group 3.
- “One big suburb” cities: A group of cities tend to be like Republican-run cities in many ways: most of them have annexed hundreds of miles of suburban territory, which makes their politics somewhat more centrist. They tend to be in the South and West but there are a couple of Midwestern exceptions.
I note that some cities don’t fit into any of these categories. Rust Belt cities like Pittsburgh and Buffalo are too white for category 4, have annexed too little suburbia for category 5, are not dense enough for category 2, and not left-wing enough for category 3. I have also excluded cities with nonpartisan mayors and cities that are basically suburbs of other cities (like Mesa).
Which are the most dangerous cities in America?
In four of the ten Republican-run core cities (Lexington, Tulsa, Miami and Oklahoma City), homicides actually fell between 2019 and 2023. But the others present a mixed picture: homicide rose by 1 percent in Fresno, 5 percent in Lubbock, 8 percent in Fort Worth and Omaha, about 14 percent in Bakersfield, and 28 percent in Stockton. So the median red-city homicide increase is 1–5 percent, although there’s a pretty wide variation between the best and worst cities.
I also note that these increases are from a fairly low base, because no red city has an insanely high homicide rate: the most deadly, Stockton, had 13 murders per 100,000 residents in 2023, the 30th highest among the 90 cities listed by American Violence.I suspect this has something to do with the fact that most of the Republican cities have annexed huge chunks of middle-class suburbia. Only two of the ten red cities (Stockton and Miami) include less than 100 square miles.
What about the six dense cities? Homicides fell between 2019 and 2023 in only one of the six (Boston). Homicides increased by almost 60 percent in Washington, just over 30 percent in Chicago and San Francisco, 14 percent in New York, and 12 percent in Philadelphia. To put it another way, the median homicide increase in this group was over 30 percent — from a fairly high base in the case of Chicago, Philadelphia, and Washington, but from a fairly low base in the case of the other three cities. (San Francisco, New York and Boston all have lower homicide rates than Stockton).
What about progressive cities? Crime rose more here than in either the dense cities or the Republican cities. In all of my six progressive cities, homicides rose by over 30 percent. Homicides rose by 32 percent in Los Angeles, 64 percent in Oakland, 51 percent in Minneapolis, 85 percent in Seattle, 99 percent in Austin, and over 100 percent in Portland in all cases, from a relatively low base. (Even after these massive increases, four of the six cities were safer than Stockton). If I’m right in assuming that these cities are more left-wing than my Group 4 and 5 cities, then the correlation between leftish politics and rising crime might be significant. (But that’s a big if, especially since I’m talking about a pretty small group of cities).
By contrast, the Black cities were a mixed bag. The murder rate actually decreased in Baltimore and Detroit. On the other hand, homicide rates rose by 87 percent in Memphis, 45 percent in Cleveland, 20 percent in Baton Rouge and 29 percent in Atlanta. In Rust Belt cities with large-but-not-majority-Black populations, there was also no clear pattern: homicides nearly doubled in Milwaukee but declined in Buffalo, Cincinnati, and St. Louis.
The last and largest group is a mix of cities that are currently run by Democrats but that tend to be more suburb-dominated and less known for progressivism than Portland or San Francisco. This group include five cities where murders decreased (including Long Beach, El Paso, Charlotte, San Jose and San Diego), as well as Durham (2 percent increase), Dallas (6 percent increase), Sacramento (10 percent increase), Indianapolis (11 percent), Kansas City (13 percent), Nashville (16 percent), Raleigh (18 percent), Houston (20 percent), Albuquerque (ditto), Denver (21 percent), Winston-Salem (ditto), Tampa (23 percent), Fort Wayne (32 percent), St. Petersburg (ditto), Phoenix (50 percent increase), Lincoln (54 percent, but from a very low base), and Greensboro (57 percent). In this large group, the median increase was in the high teens — more than in most Republican cities, less than in the progressive cities.
What's the verdict?
In sum, it seems that by 2023 a pattern has emerged: very mild homicide increases in cities with Republican mayors, large increases in the most progressive lower-density cities, and a more mixed pattern in other types of cities with Democratic mayors. However, there does seem to be considerable overlap between the Republican-run cities and the other categories: at least one city in Groups 2, 4 ,and 5 also experienced decreases. A more scientific study would find ways to distinguish progressive cities from moderate ones a bit more precisely, and might involve a larger sample size.
Editor's note: For an analysis of violent crime trends in Europe and the drivers behind them, check out Michael's But... Europe blog post.


Election 2024: Red vs. Blue States
In a speech on Sunday at the Ronald Reagan Presidential Library in Simi Valley, California, likely Republican presidential contender Gov. Ron DeSantis of Florida said that the pandemic was “a great test in governing philosophies."
Mixed Use Could Lower Neighborhood Crime Rates
New research shows areas with a heavy concentration of commercial offices experience 40 percent higher crime rates than neighborhoods that mix residential and commercial uses.
Infrastructure Investment for Public Safety: Lessons from Medellín
A natural experiment in Medellín indicates that infrastructural investments can reduce crime and improve perceptions of public safety.

Planetizen Federal Action Tracker
A weekly monitor of how Trump’s orders and actions are impacting planners and planning in America.
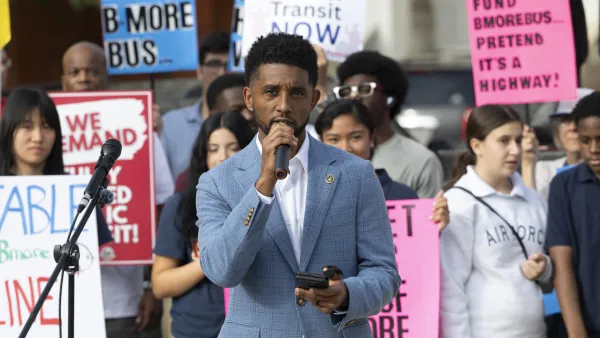
‘Going backwards:’ Baltimore mayor, students rally against state's transit funding plan
Maryland's proposed six-year plan provides no funding for Baltimore’s BMORE bus program and reduces its road maintenance funding.
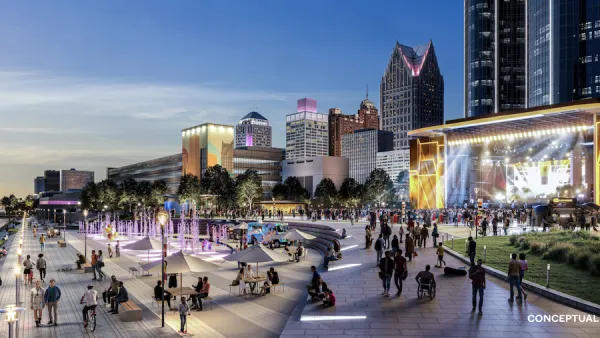
Detroit to transform waterfront with $2.2 billion investment
Developers will convert about 18 acres of unused parking lot space into civic spaces.

HUD, USDA agree on framework to simplify housing environmental review standards
Their agreement is a requirement of the 21st Century ROAD to Housing Act.

Cost of water rising at a faster pace than inflation, median household income
California and Maryland residents have seen their water bills grow especially high.

NYC building owners overwhelmingly comply with new emissions limits
The New York City Department of Buildings is fining owners who did not file emissions reports.

FREE Course: Walkable City 1: Why Walkability?
After describing his path towards focusing on walkability as the essence of good planning, Jeff Speck marches through his five principal reasons for making more walkable places.
Reinventing Malls: Planning Alchemy—Turning Gray Fields Into Gold
The course focuses on the opportunities and imperatives that shape reinvention of mall sites.

planning NEXT
City of Thousand Oaks
City of Wisconsin Rapids
The Architects Foundation
University of Cincinnati Online
Northern Illinois Transit Authority (NITA)
The Pocatello Development Authority
The Urban Renewal Agency of the City of Pocatello

