A new infographic breaks down how much space is devoted to buildings, green space, and roads in 15 major U.S. cities.


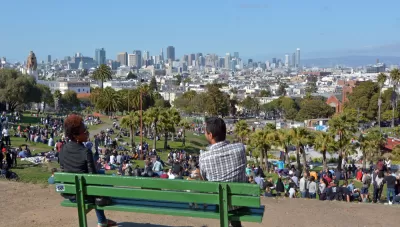
Geotab, a company devoted to "Internet of Things" (IoT) and transportation technology, has created a nifty little infographic that shows how much space is devoted to roads, green space, and buildings in 15 major cities.
The infographic uses OpenStreetMap data and U.S. Census population estimates to generate the infographic, allowing comparisons between cities like Boston, Chicago, Dallas, and San Francisco. Population density and space allocation are easily visible. The infographic is also sortable by space devoted to roads, green space, and buildings.
FULL STORY: Urban Footprint

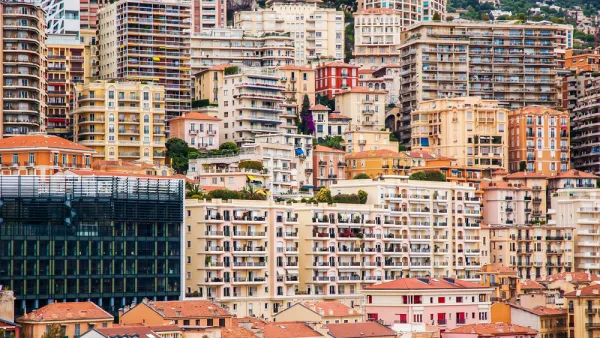
Pop Quiz: Can You Identify Cities By Density Alone?
A Planetizen editor failed this quiz.
15 US cities and their global namesakes
Hundreds of cities around the United States are named after other places. We tour a few of them.
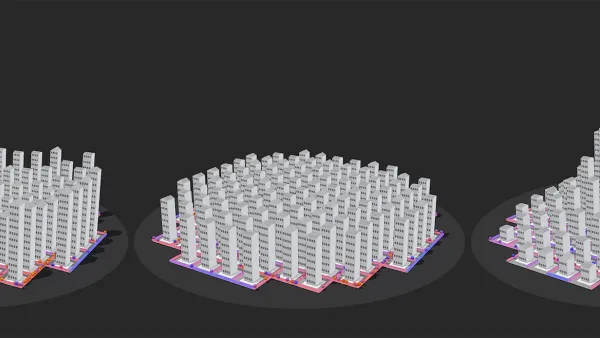
New study visualizes how city shapes impact mobility
Whether circular or linear, the shape and layout of cities affects how their residents get around.
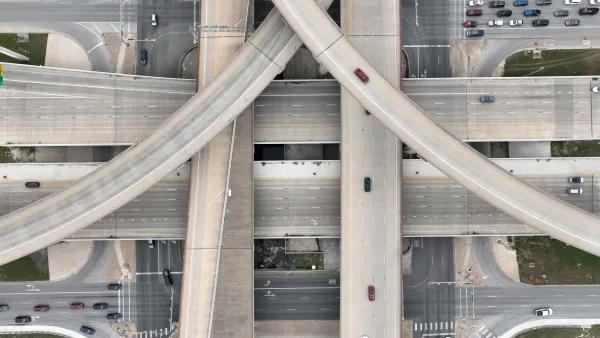
The state-sanctioned urbicide of Austin
People don’t kill cities. Freeways do.
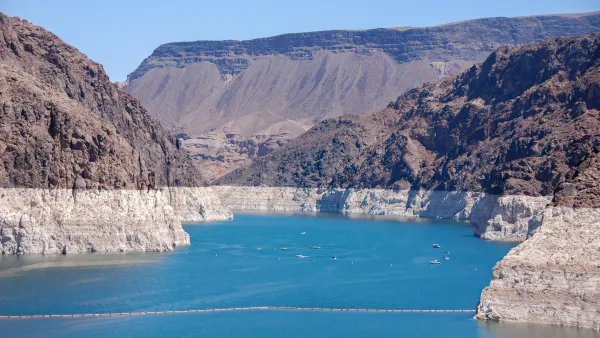
US to reduce Colorado River water deliveries to Mexico
A new Colorado Treaty amendment reduces Mexico’s Colorado River water allocation by 250,000 acre feet.
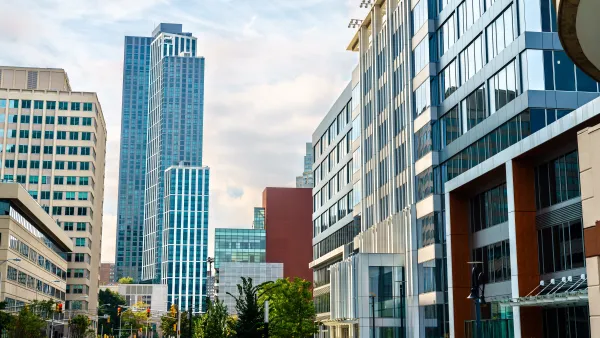
New Jersey’s second-largest city bans standalone data centers
Jersey City will continue to allow co-location facilities, such as those meant for research institutions that store their own data.
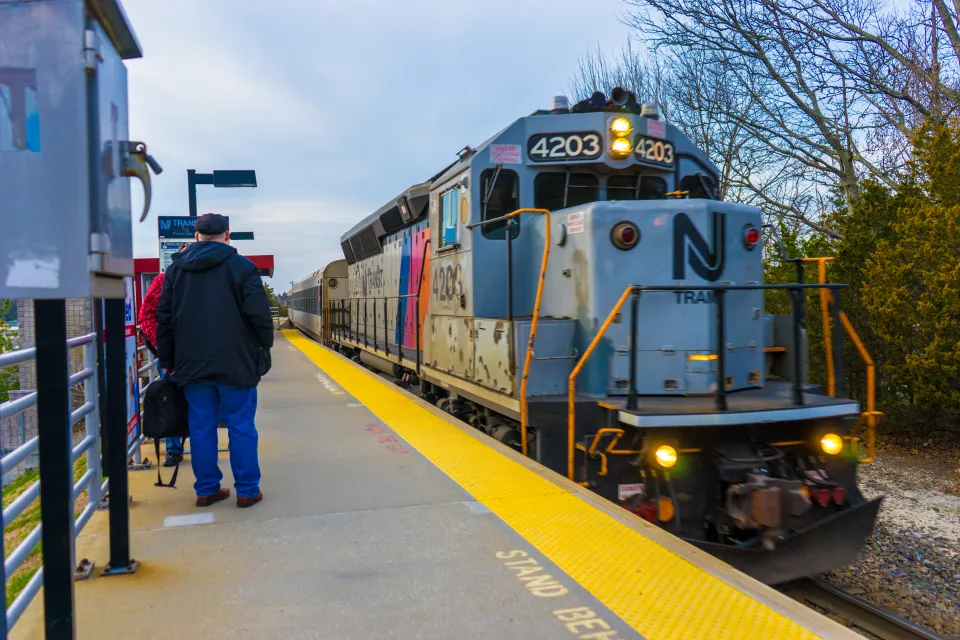
Amtrak not solely to blame for New Jersey commuter rail's unreliability, report finds
A new study from the Garden State Initiative found that NJ Transit’s budget grew 20% across a 4 year period, but reliability declined significantly over the same period.
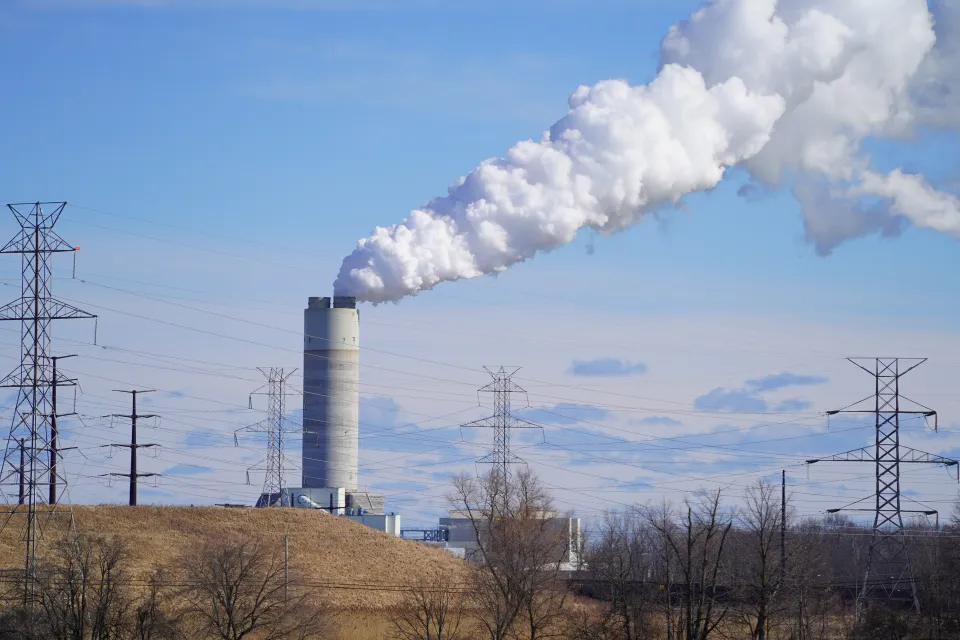
EPA erases limits on planet-warming pollution from power plants
Under Monday’s plan, power plants would still have some limits on how much mercury, arsenic and other contaminants they can emit.
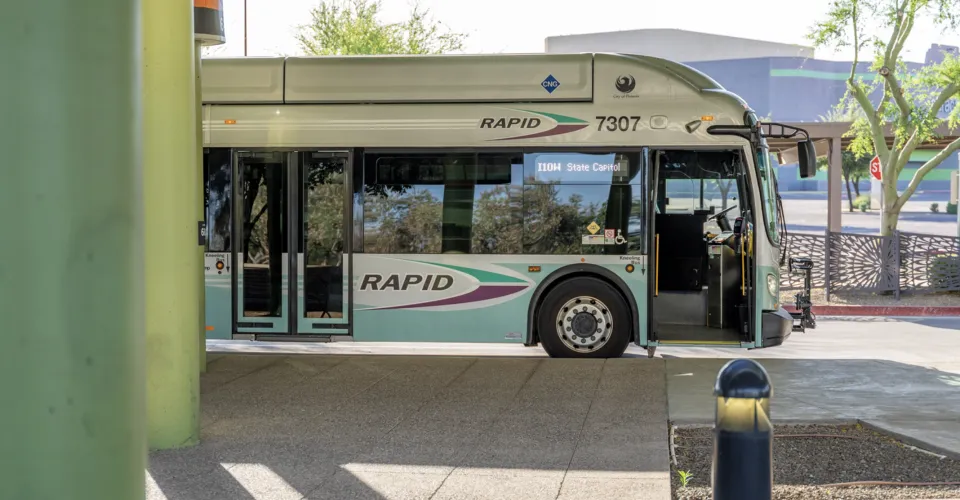
Phoenix announces new on-demand transit service, more frequent RAPID buses
Both new services will launch in October, and are part of Phoenix's Project Effective Access Solutions for Easing Congestion.

FREE Course: Walkable City 1: Why Walkability?
After describing his path towards focusing on walkability as the essence of good planning, Jeff Speck marches through his five principal reasons for making more walkable places.
Reinventing Malls: Planning Alchemy—Turning Gray Fields Into Gold
The course focuses on the opportunities and imperatives that shape reinvention of mall sites.

Eagle County Government
Harvard University Graduate School of Design
Nashville Planning Department
The Architects Foundation
University of Cincinnati Online
The Pocatello Development Authority
The Urban Renewal Agency of the City of Pocatello
Journal of the American Planning Association