


An analysis of three essential attributes of urban grids reveals a preferred layout for the desired effect of a vibrant, active community.

Orthogonal layouts, or grids, have a history stretching to Babylon, but scholars still can't fully explain their emergence, given that their counterparts—organic layouts—have flourished for just as long. Recently, a vigorous debate has sprung up about whether grids are the right choice for laying out future communities. Some argue that the grid's merits are hard to ignore. Others believe that those merits are exaggerated, and the grid's defects are just as hard to discount. We stir some more evidence into the debate, ultimately calling for a balanced use of the grid's attributes.
One element debated in this conversation is land use efficiency (LUE), which is inherent in any layout, regular or irregular, orthogonal or otherwise. The grid's LUE is the easiest to calculate of all known layouts, due to its regularity and repetition. First, we will determine how the grid's configuration affects LUE. Because all layouts are made up of blocks and streets, results from these and related calculations may then be generalized to other layouts.
Land Use Efficiency (LUE)
One argument focusing on the LUE states: "The rise and fall of cities is not based on the amount of land they have available alone." This statement acknowledges the high complexity of cities as systems, and after devaluing LUE, it proposes "to supplement or replace the LUE ratio with the concept of street frontage and access" because "[…] street frontage is critical in creating vibrant, varied, and sustainable places." This assertion puts an enormous, and unlikely, importance on just one physical attribute—frontage. But even assuming a secondary role for LUE, it must still be understood as a factor, whatever its influence.
Moreover, because LUE, frontage, and access all flow logically from the same geometry, it is instructive and nearly impossible not to observe the interplay between all three. It is well understood that land use efficiency matters for sustainability; frontage matters for enterprise; and connectivity is instrumental for walkability. Only after measuring them each can we choose judiciously.
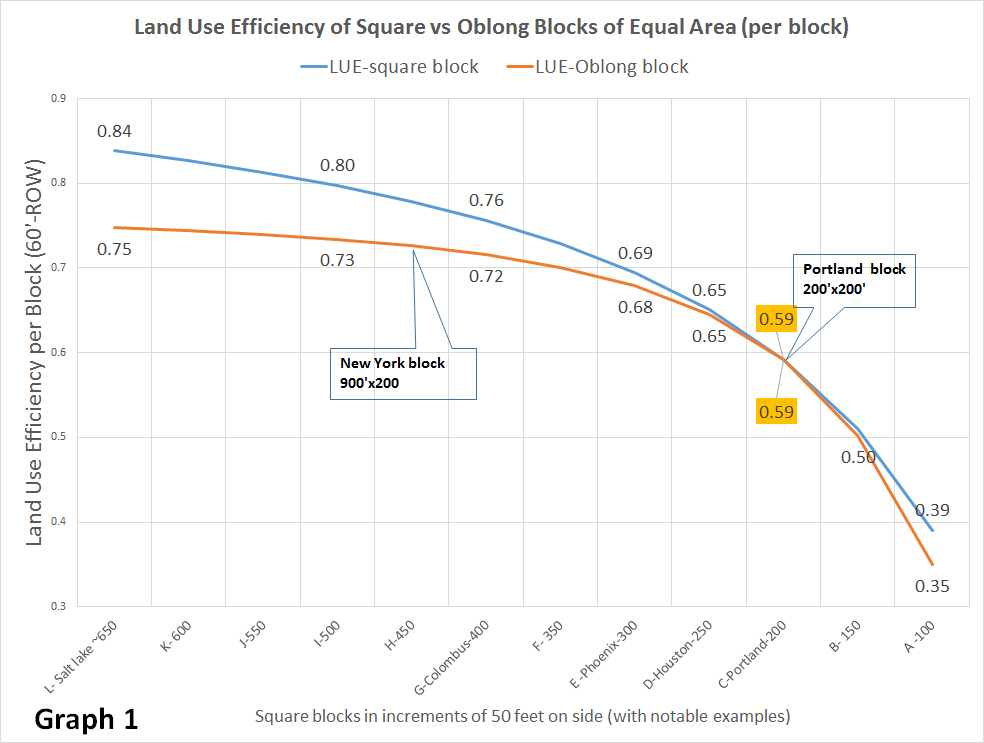
Graph 1 shows calculated LUE values of three known block configurations. Derived from actual dimensions, the numbers show that the New York block is 26% more efficient than Houston's and 22% more efficient than Portland's. The calculation reveals the influence of right-of-way (ROW) width, which varies from block to block, on the results.
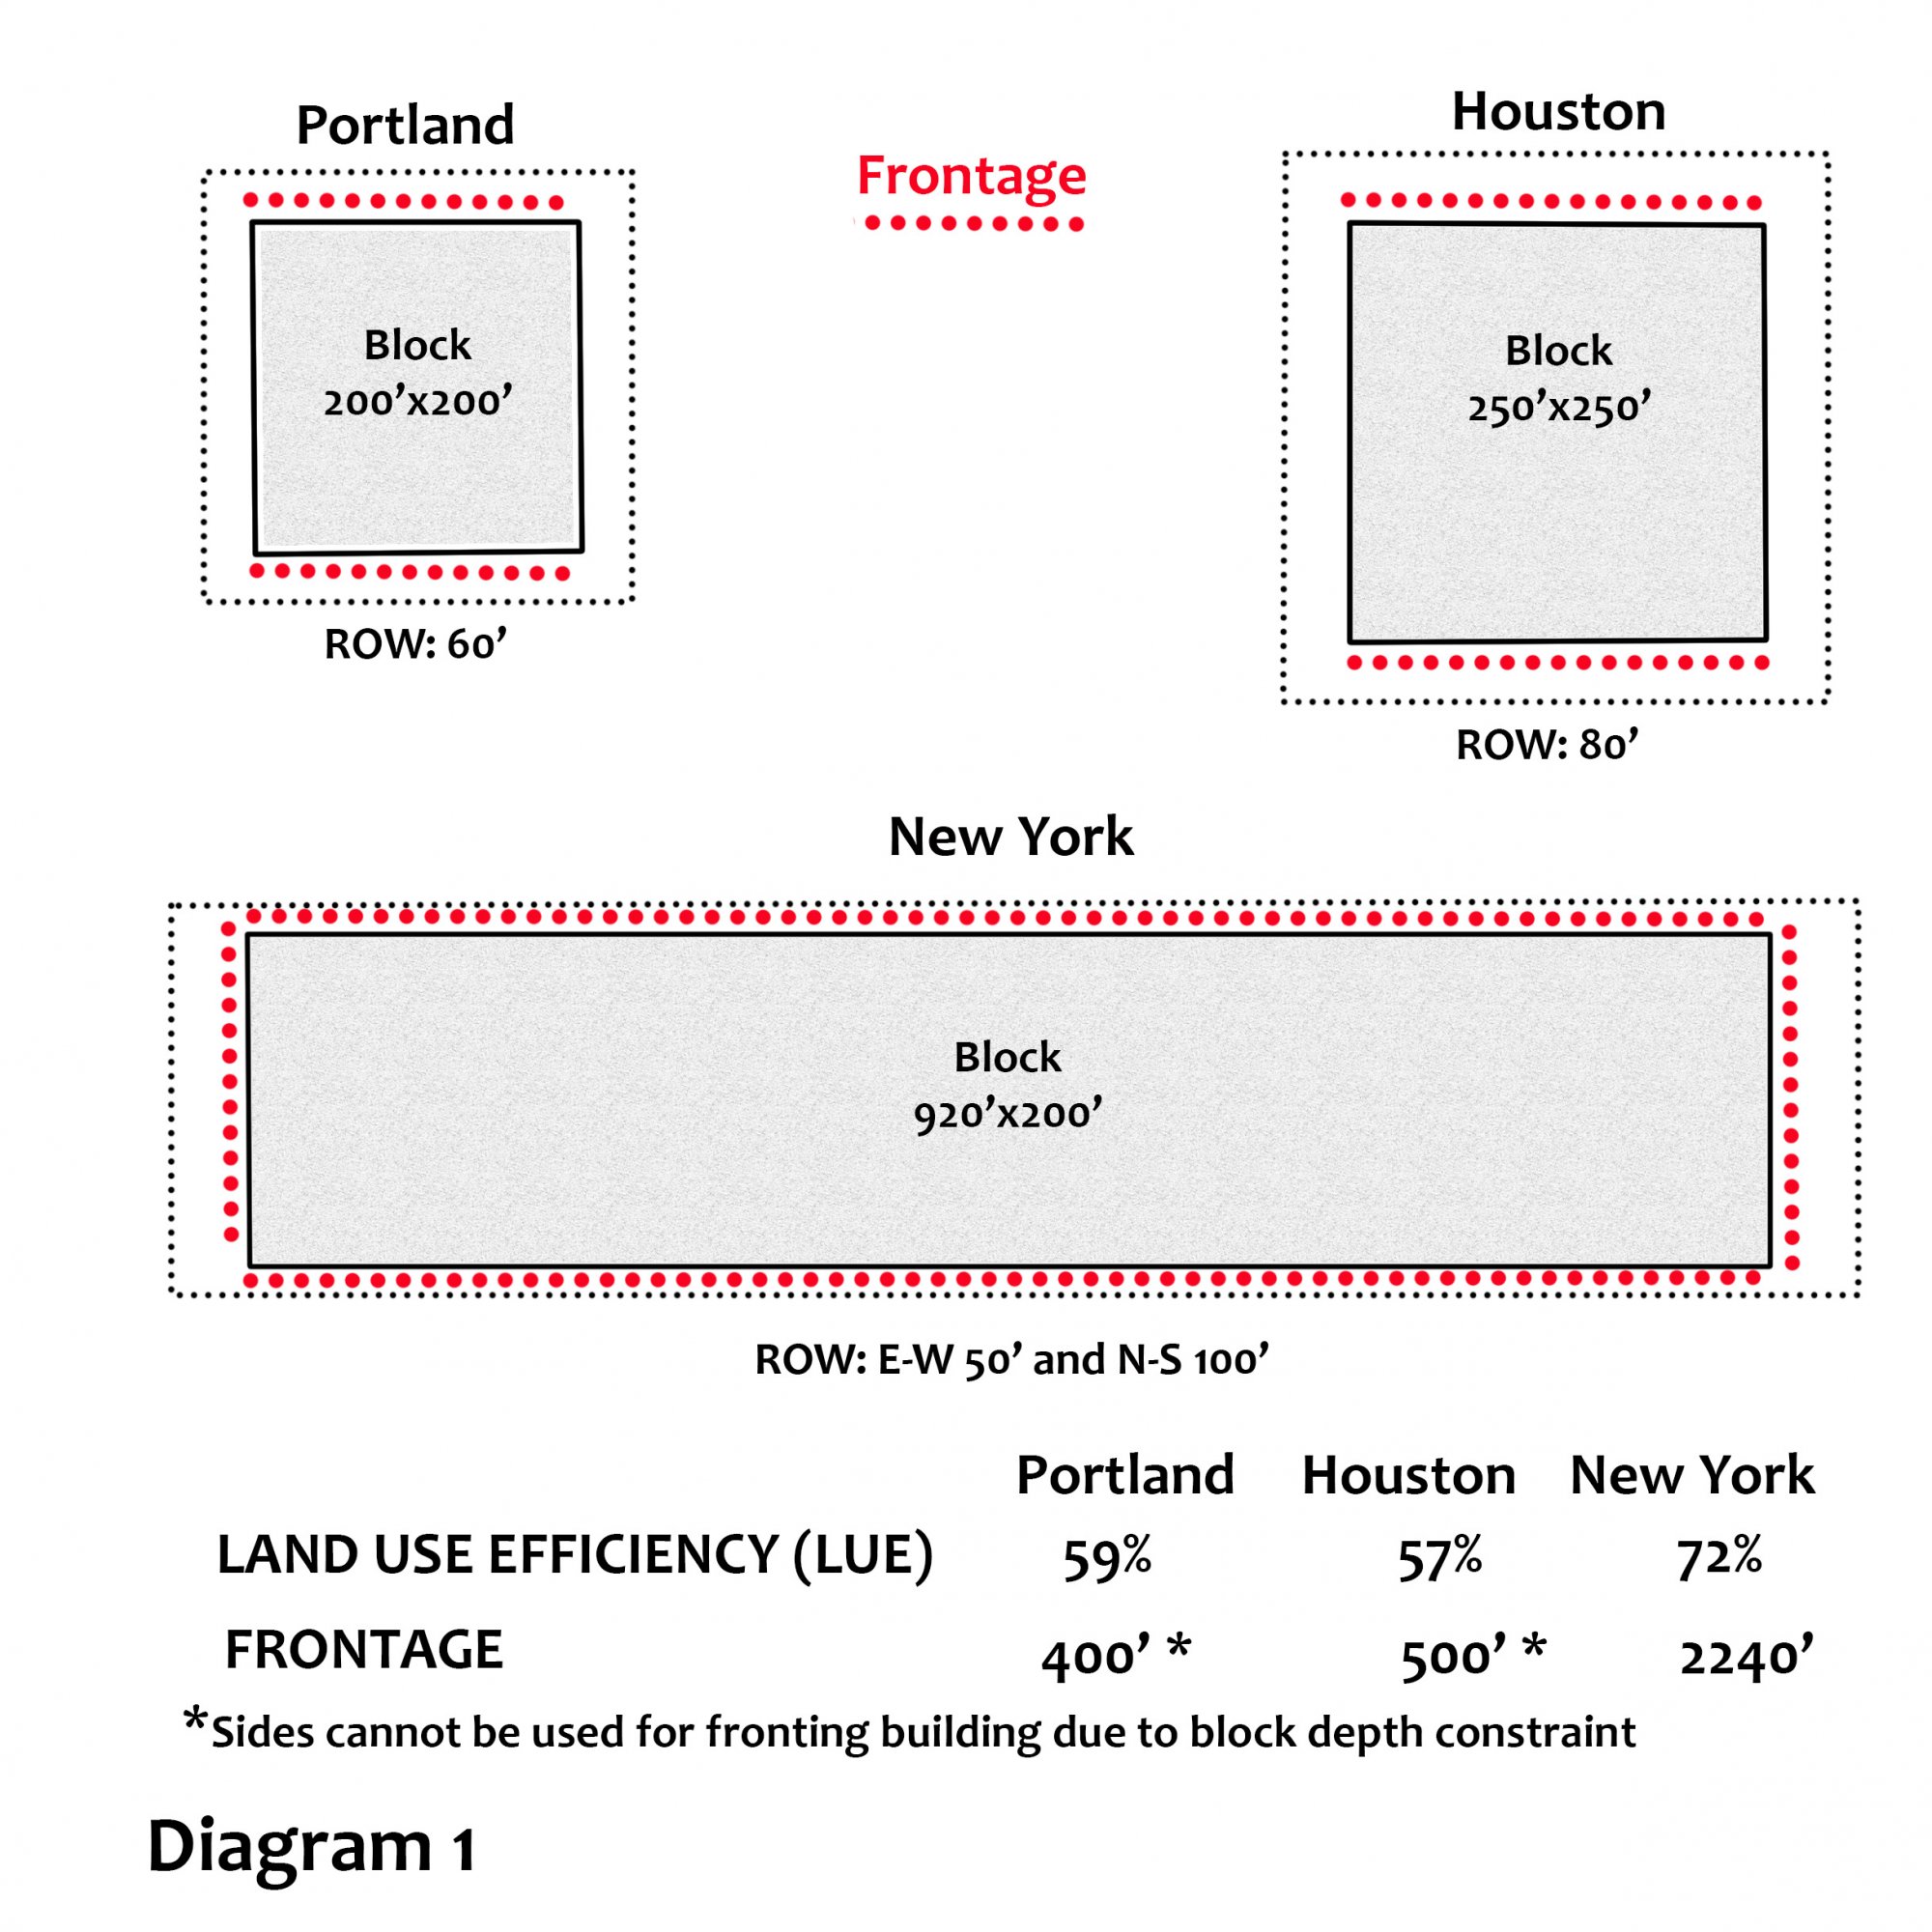
More consistent and comparable LUE values ensue from applying identical ROW widths to all. These recalculated values are: Portland 59%, Houston 65%, and New York 72%. The increase in LUE with block size makes sense: the larger the block, the lower the ROW area per given land parcel and the higher the LUE ratio. This math is not lost to developers; greenfield blocks have been growing in length since the '50s. In theory, as Graph 1 shows, square blocks are even more efficient as they grow beyond the basic 200' by 200' dimension. The graph also reveals that gains in LUE decline and eventually plateau past the 450’x450’- block or its 920' oblong area equivalent in New York. How long (or big) cannot be settled without considering street frontage and access.
Street Frontage (SF)
Conceding, tentatively, that frontage surpasses LUE in importance, we calculate it (with red doted lines) for the three blocks in diagram 1. The results show: Portland at 400 linear feet, Houston at 500', and New York at 2240'. These numbers acknowledge that Portland's and Houston's east and west sides cannot be used to front properties; the land is already used up by the properties fronting the other two streets.

Graph 2 reveals that frontage length grows faster for oblong blocks than square ones. The Portland 200'x200' block marks a departure point. Differentiation accelerates after the 300'x300' block. At the 400' side dimension, the difference is substantial; the oblong frontage is 25% higher and at the next block size, 450' (a New York equivalent), would be 34.7% higher. This advantageous arithmetic explains New York's choice in the 1811 Commissioners' Plan and why numerous layouts from the 1960s on have used blocks quarter-mile long (1320'); frontage is a saleable commodity. While the per block arithmetic is unequivocal, the per parcel of land frontage advantage is not as self-evident.
Table 1: Comparison of square and oblong blocs within 160-acre land parcel
|
Block sides (feet) |
Block area net, with ROW |
Block and total Frontage |
|||||
|
Side A |
Side B |
blocks |
Block Area |
Area+ROW |
Block (feet) |
Total (feet) |
|
|
Square block |
468 |
468 |
25 |
5.02 ac |
6.4ac |
1872 |
46800 |
|
Oblong Block |
820 |
204 |
30 |
3.84 ac |
5.3 ac |
2048 |
61440 |
|
Oblong Block |
600 |
204 |
40 |
2.8 ac |
4.0 ac |
1608 |
64320 |
Table 1 shows the difference in total frontage length for 25 (square), 30, and 40 oblong blocks, embedded precisely in a 160-acre parcel. As expected, the square block has the least total frontage due to its large size and shape. However, the shorter 600' block alternative produces 4.7% more frontage than the New York nearest equivalent (820'). This increase, however, comes at a 2.5% LUE cost. It would also increase infrastructure costs due to the added road (access). Is there an optimal block length for LUE, frontage, and access?
Access
Since increasing frontage could mean more property, variety, and vibrancy, we need to determine what constitutes "adequate" access, balancing frontage and access for optimum benefit. "Connectivity," a synonym for access, is now a well-defined and precise quantity in planning literature.
Grids allow the easy calculation of connectivity due to their repetitive geometry. Table 2 shows quantities for elements involved in deriving a connectivity index score for five grids, based on 160-acre land parcel. The trend is obvious: as the block increases in size, the connectivity index drops.
Table 2: Block sizes, intersection, and block frequency and connectivity index of five networks
|
Blocks and |
Portland |
Houston |
Oblong A |
Oblong B |
New York |
|
Intersections/160 acres |
121 |
90 |
74 |
60 |
40 |
|
Blocks per 160-acre area |
100 |
72 |
58 |
44 |
27 |
|
Connectivity Index |
1.81 |
1.78 |
1.77 |
1.71 |
1.65 |
These index figures surpass what regulators consider "adequate" connectivity, a range between 1.4 for greenfield development to 1.7 for more central locations or "activity centers." However, regulators draw attention to the difference between connectivity and permeability, thus providing another set of indices for "active transportation," ranging from 1.6 to 1.9. None of these blocks fall below the minimum but none also reach the maximum, perhaps suggesting that it may be idealistic, given that Portland blocks or smaller are not in in use (understandably, given their lowest LUE rating).
Conclusion
Using the grid's simple geometry as a means to calculate three essential attributes—i.e., LUE, frontage and connectivity of any layout—we find that LUE declines as block size drops (whether square or oblong) either per block or per given land area (e.g. 160 acres). Blocks equal in area produce more frontage when oblong than square. Frontage per block increases as the block size increases but drops per land parcel. Frontage per land area increases with declining block size but this increase comes with a substantial drop in land use efficiency especially below the 2.8-acre size block. Connectivity is affected by block size, but oblong blocks up to 920’ are well within acceptable thresholds of connectivity indices.
Consequently, if the goal is to create vibrant, varied, connected, and sustainable communities, then larger, oblong blocks, including New York's, offer a greater chance to achieve that goal. Larger, oblong blocks simultaneously provide more buildable land, more frontage, and sufficient connectivity. They balance competing planning priorities for optimum effect.

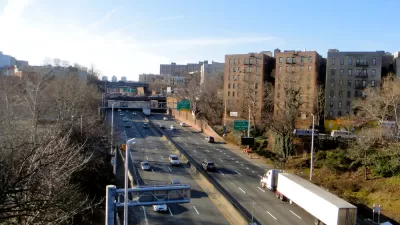
The Case for Urban Highway Removal
Instead of removing urban freeways, which have proven to be destructive to communities and economies—in some cases deliberately so—many cities are expanding freeways in and around cities.

Analysis of Downtown Recoveries Reveals Post-Pandemic Winners and Losers
The recovery of U.S. downtowns is happening at widely different paces depending on which city you consider.

New York City Subway Pledges To Increase Accessibility
After two lawsuits, the New York subway system has announced a 33-year timeline for making 95 percent of its stations fully accessible.

Maui's Vacation Rental Debate Turns Ugly
Verbal attacks, misinformation campaigns and fistfights plague a high-stakes debate to convert thousands of vacation rentals into long-term housing.

Planetizen Federal Action Tracker
A weekly monitor of how Trump’s orders and actions are impacting planners and planning in America.

In Urban Planning, AI Prompting Could be the New Design Thinking
Creativity has long been key to great urban design. What if we see AI as our new creative partner?

King County Supportive Housing Program Offers Hope for Unhoused Residents
The county is taking a ‘Housing First’ approach that prioritizes getting people into housing, then offering wraparound supportive services.

Researchers Use AI to Get Clearer Picture of US Housing
Analysts are using artificial intelligence to supercharge their research by allowing them to comb through data faster. Though these AI tools can be error prone, they save time and housing researchers are optimistic about the future.

Making Shared Micromobility More Inclusive
Cities and shared mobility system operators can do more to include people with disabilities in planning and operations, per a new report.
Urban Design for Planners 1: Software Tools
This six-course series explores essential urban design concepts using open source software and equips planners with the tools they need to participate fully in the urban design process.
Planning for Universal Design
Learn the tools for implementing Universal Design in planning regulations.
planning NEXT
Appalachian Highlands Housing Partners
Mpact (founded as Rail~Volution)
City of Camden Redevelopment Agency
City of Astoria
City of Portland
City of Laramie