


The City Observatory's new Cappuccino Congestion Index quantifies the delay that inadequate coffeeshop capacity imposes on caffeine consumers. For cappuccino-sucking urbanites, it is a more severe problem than traffic congestion.

A new City Observatory analysis reveals a new and dangerous threat to the nation’s economic productivity: costly and growing coffee congestion.
Yes, there's another black fluid that's even more important than oil to the function of the U.S. economy: coffee. Because an estimated 100 million of us American workers can't begin a productive work day without an early morning jolt of caffeine, and because one-third of these coffee drinkers regularly consume espresso drinks, lattes, and cappuccinos, there is significant and growing congestion in coffee lines around the country. That's costing us a lot of money. Consider these facts:
- Delays waiting in line at the coffee shop for your daily latte, cappuccino, or mocha cost U.S. consumers $4 billion every year in lost time;
- The typical coffee drinker loses more time waiting in line at Starbucks than in traffic congestion;
- Delays in getting your coffee are likely to increase because our coffee delivery infrastructure isn’t increasing as fast as coffee consumption.
Access to caffeine is provided by the nation's growing corps of baristas and coffee bars. The largest of these, Starbucks, operates some 12,000 locations in the United States alone. Any delay in getting this vital beverage is going to impact a worker’s start time–and perhaps their day's productivity. It's true that sometimes, you can walk right up and get the triple espresso you need. Other times, however, you have to wait behind a phalanx ordering double, no-whip mochas with a pump of three different syrups, or an orange-mocha frappuccino. These delays in the coffee line are costly.
To figure out exactly how costly, we’ve applied the "travel time index" created by the Texas Transportation Institute to measure the economic impact of this delay on American coffee drinkers. For more than three decades TTI has used this index to calculate the dollar cost of traffic delays–here we use the same technique to figure the value of "coffee delays."
The travel time index is the difference in time required for a rush hour commute compared to the same trip in non-congested conditions. According to Inrix, the travel tracking firm, the travel time index for the United States in July 2014 (the latest month for which they’ve released this data) was 7.6, meaning that a commute trip that took 20 minutes in off-peak times would take an additional 91 seconds at the peak hour.
We constructed data on the relationship between customer volume and average service times for a series of Portland area coffee shops. We used the 95th percentile time of 15 seconds as our estimate of “free flow” ordering conditions—how long it takes to enter the shop and place an order. In our data-gathering, as the shop became more crowded, customers had to queue up. The time to place orders rose from an average of 30 to 40 seconds, to two to three minutes in "congested" conditions. The following chart shows our estimate of the relationship between customer volume and average wait times.
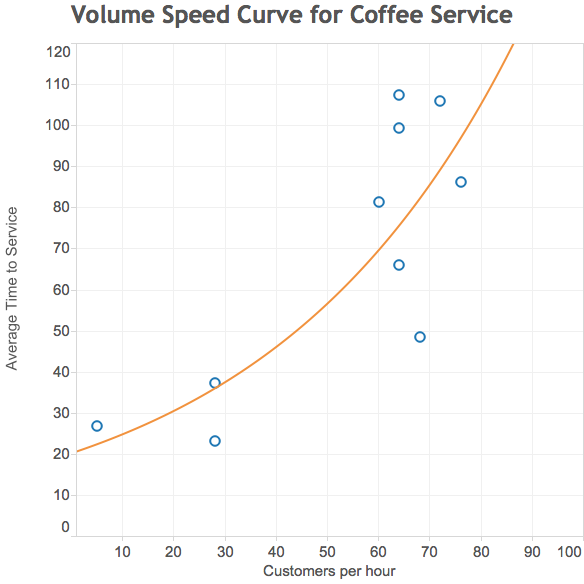
Following the TTI methodology, we treat any additional time that customers have to spend waiting to place their order beyond what would be required in free flow times (i.e. more than 15 seconds) as delay attributable to coffee congestion.
Based on our observations and of typical coffee shops and other data, we were able to estimate the approximate flow of customers over the course of a day. We regard a typical coffee shop as one that has about 650 transactions daily. While most transactions are for a single consumer, some are for two or more consumers, so we use a consumer per transaction factor of 1.2. This means the typical coffee shop provides beverages (and other items) for about 750 consumers. We estimate the distribution of customers per hour over the course of the day based on overall patterns of hourly traffic, with the busiest times in the morning, and volume tapering off in the afternoon.
We then apply our speed/volume relationship (chart above) to our estimates of hourly volume to estimate the amount of delay experienced by customers in each hour. When you scale these estimates up to reflect the millions of Americans waiting in line for their needed caffeine each day, the total value of time lost to cappuccino congestion costs consumers more than $4 billion annually.
FULL STORY: The Cappuccino Congestion Index


Planetizen Federal Action Tracker
A weekly monitor of how Trump’s orders and actions are impacting planners and planning in America.

Chicago’s Ghost Rails
Just beneath the surface of the modern city lie the remnants of its expansive early 20th-century streetcar system.

Amtrak Cutting Jobs, Funding to High-Speed Rail
The agency plans to cut 10 percent of its workforce and has confirmed it will not fund new high-speed rail projects.

Ohio Forces Data Centers to Prepay for Power
Utilities are calling on states to hold data center operators responsible for new energy demands to prevent leaving consumers on the hook for their bills.

MARTA CEO Steps Down Amid Citizenship Concerns
MARTA’s board announced Thursday that its chief, who is from Canada, is resigning due to questions about his immigration status.

Silicon Valley ‘Bike Superhighway’ Awarded $14M State Grant
A Caltrans grant brings the 10-mile Central Bikeway project connecting Santa Clara and East San Jose closer to fruition.
Urban Design for Planners 1: Software Tools
This six-course series explores essential urban design concepts using open source software and equips planners with the tools they need to participate fully in the urban design process.
Planning for Universal Design
Learn the tools for implementing Universal Design in planning regulations.
Caltrans
City of Fort Worth
Mpact (founded as Rail~Volution)
City of Camden Redevelopment Agency
City of Astoria
City of Portland
City of Laramie