Whether it is a soccer field or a volleyball court, New Yorkers face vastly different journeys depending on where they live. Our analysis shows how some of the city's marginalized communities face longer trips just to play the game they love.


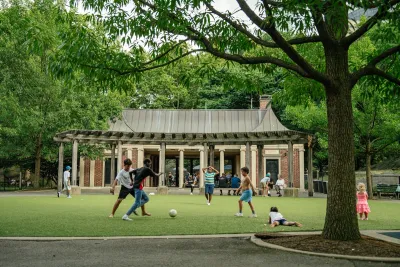
When the World Cup came to New York City last summer, Mayor Zohran Mamdani touted the city as a natural home for the world’s game: “There is no better place on earth to host the world’s game than a city where every nation is already represented, where every language is spoken and every cuisine is eaten.” Beyond the excitement of the World Cup, soccer has long been part of everyday life for New Yorkers, bringing people together on public fields across the city.
From immigrant teenagers playing in South Bronx United's Global Youth League at Foster Park in the Bronx, to West African asylum seekers finding community through soccer in Bushwick and Williamsburg, to Venezuelan migrants forming soccer teams at Flushing Meadows Corona Park in Queens, New York City's cultural diversity is deeply reflected in the soccer games played across the city.
A 2024 New York Times report from Flushing Meadows Corona Park captures the power of soccer up close. Regardless of the weather in NYC, some 100 community-organized league soccer games are played across over 20 fields on Sundays. Around the games, a larger social world takes shape as people spend the day watching, eating, talking and reconnecting. For a lot of immigrant New Yorkers, soccer offers a piece of familiarity in a new city and a community that can make it feel a little more like home.
Of course, all of this depends on having somewhere to play. A field can become a gathering place for immigrant communities only if they can reach it conveniently. So, how easy is it to actually reach a soccer field?
A long trek to a soccer field
I met Mark, a second generation Ugandan American at Queensbridge Park on a September evening. During the fall, he organizes a pickup soccer game every Tuesday evening that brings together players from different neighborhoods. “This is actually the closest field to where I live, and it still takes me half an hour to get here,” said Mark, who spends around 25 minutes on the Q69 bus and another five minutes on foot traveling from his apartment in Astoria. “I wish there was somewhere closer. It'd be nice to have a field where I can walk to.”
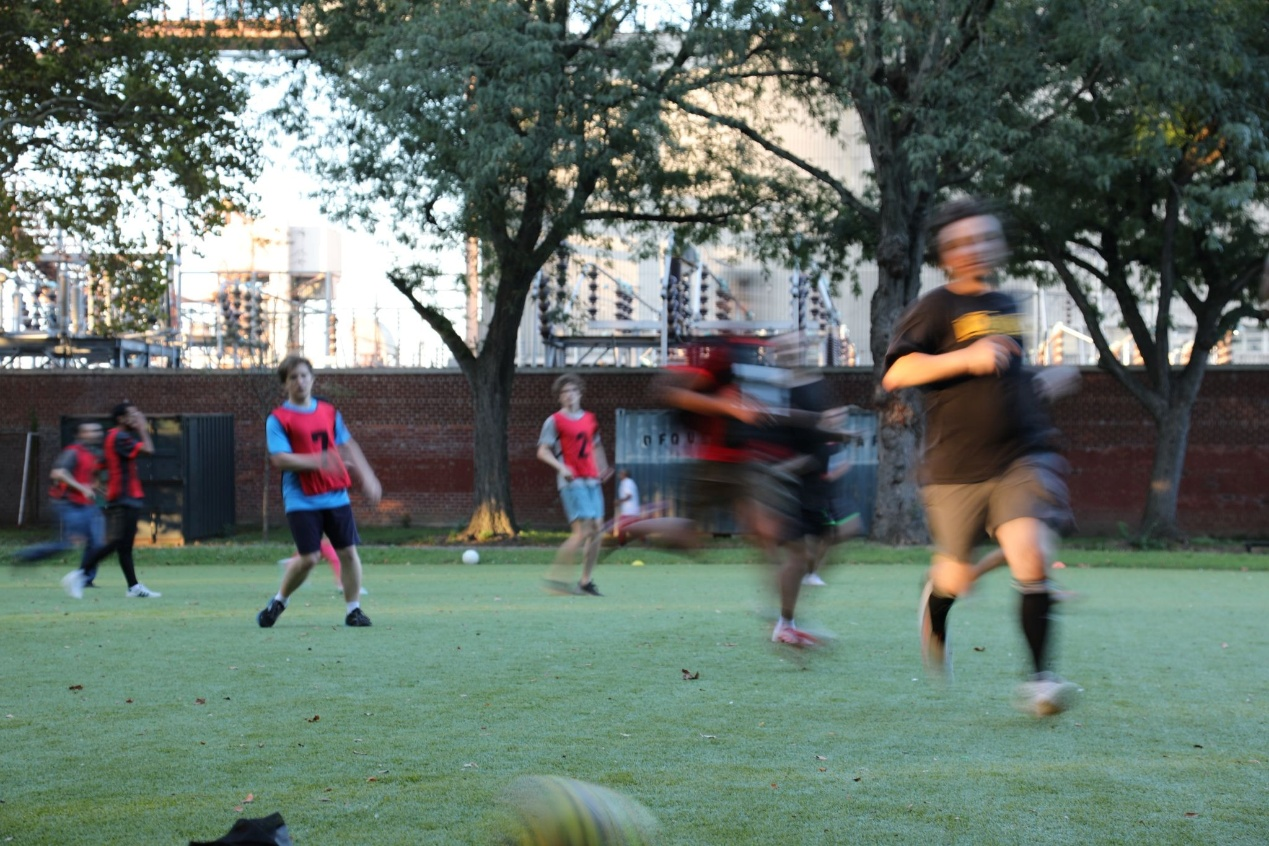
After the game, I brought up my encounter with Rongyu, a friend of mine from the Urban Technology program at the University of Michigan who shares my interest in transportation and social equity. Mark’s experience piqued our curiosity about how long New Yorkers have to travel to reach their nearest public soccer field. With our background in urban research and data visualization, we decided to investigate it further.
To find out, we took the geographic centers of NYC’s census tracts, and calculated the travel times to their nearest active public soccer field, identified using the Athletic Facilities dataset from the NYC Open Data portal. The travel time calculation is based on OpenStreetMap's street network and NYC's subway, bus and ferry schedules, which are publicly available in the MTA developer portal. We then combined these travel times into a population-weighted average for each neighborhood, using the population data from the 2020-2024 U.S. Census Bureau's American Community Survey.
We chose the average travel time as the metric for simulating real-life soccer field accessibility instead of a naive neighborhood-bounded density map, since residents of one neighborhood might be closer to a facility in an adjacent neighborhood.
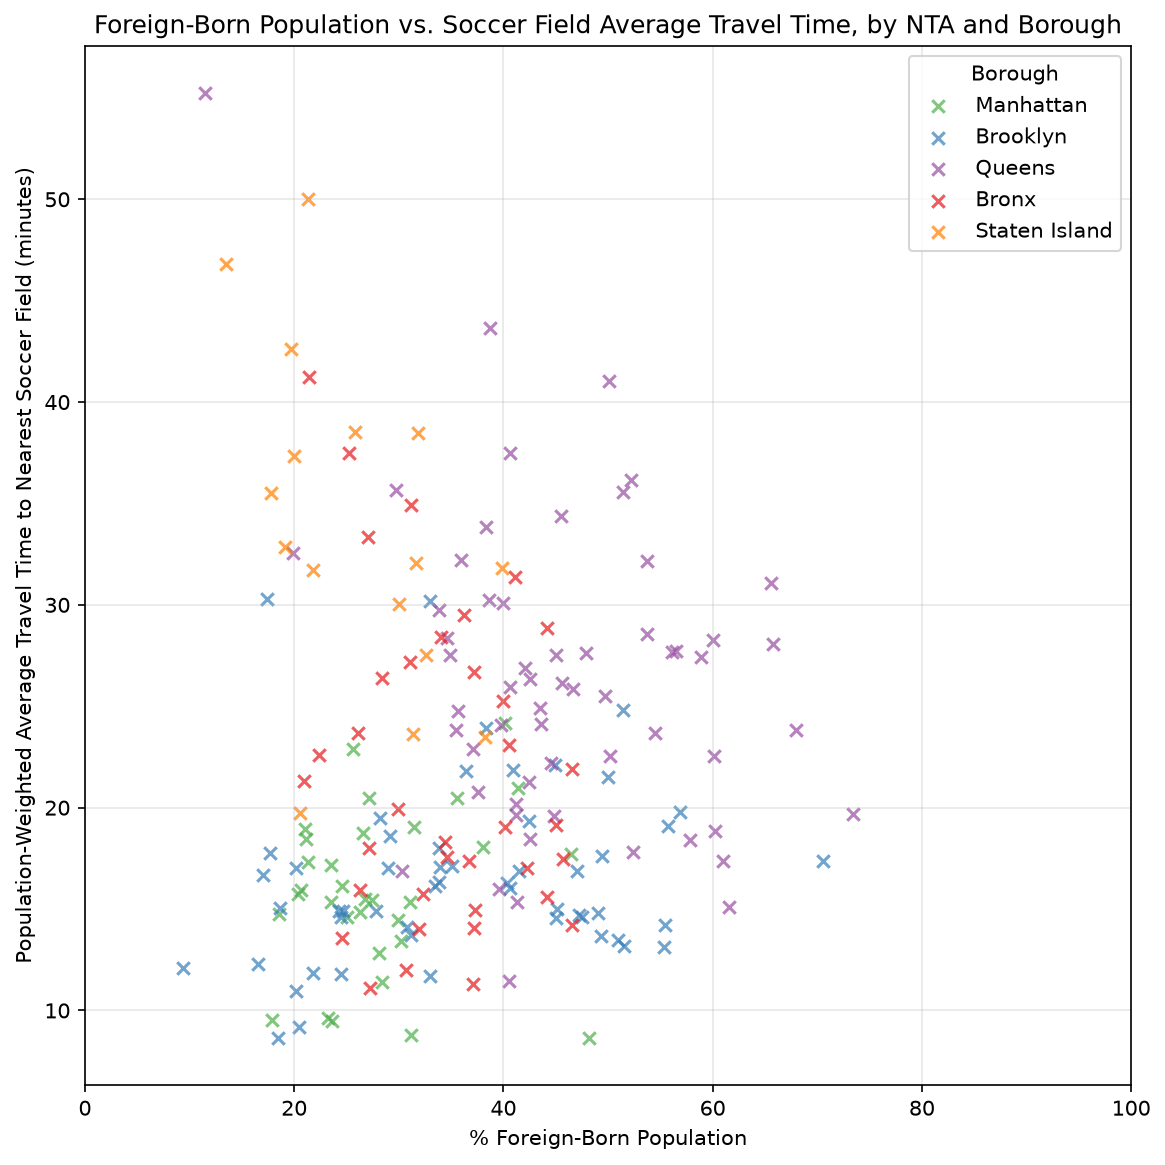
Using this measure, we compared the percentage of foreign-born residents in each neighborhood with the average travel time to the nearest public soccer field, as shown in the scatterplot below. Despite a few outliers, the results congregating in the middle show that neighborhoods with a higher percentage of foreign-born residents tend to face somewhat longer journeys to play soccer than those with a lower one. For the immigrant communities where soccer has taken on a life far beyond the field, this uneven access is especially concerning.
What about other sports?
The correlation between the percentage of foreign-born residents and longer travel times to soccer fields prompted us to expand our analysis to other sports and see whether other marginalized communities in NYC face similar accessibility challenges.
As the maps below illustrate, travel times vary considerably for different sports. Basketball facilities are relatively accessible across much of the city, with most neighborhoods averaging less than 25 minutes to the nearest court. Volleyball, on the other hand, requires substantially longer trips in many areas, particularly in Staten Island, the Bronx and eastern Queens.
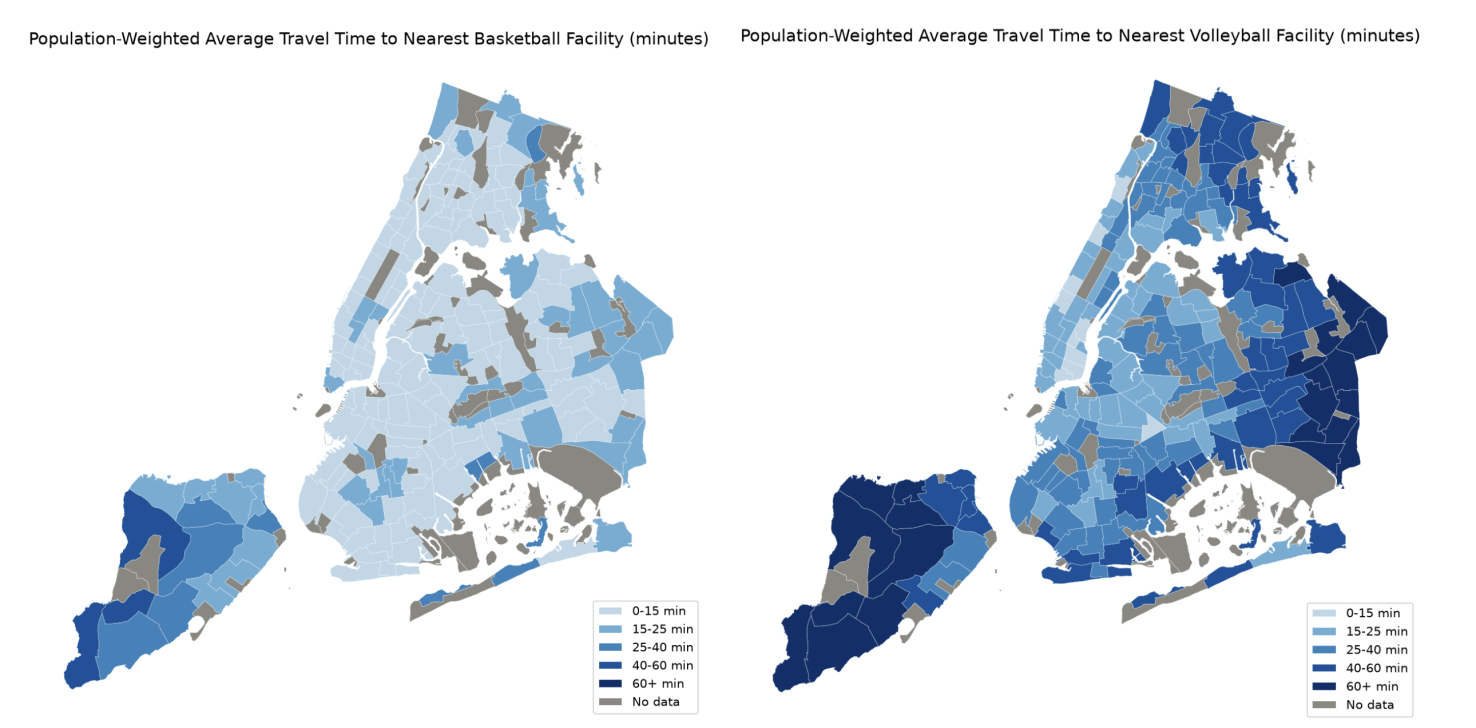
In addition to the citywide discrepancies, we also found numerous neighborhoods where access to multiple sports is poor. Take Borough Park in Brooklyn, for example: Its residents spend an average of more than 30 minutes reaching their nearest public soccer, volleyball, baseball, football and cricket facilities. According to ACS data, the neighborhood's median household income is $65,560, about 22% below the citywide median of $83,970. Borough Park is an example of a broader pattern we found where limited access to public recreation in a particular neighborhood overlaps with socioeconomic disadvantage.
Identifying neighborhoods where access falls short
Despite the citywide disparities revealing broader patterns of unequal accessibility across different sports, our findings in Borough Park draw our attention to the need to identify underserved neighborhoods across NYC, regardless of their socioeconomic or demographic makeup. We hope to address these disparities at their roots, so that where someone lives no longer determines how easily they can participate in sports in their everyday life.
To continue building on this research, we are currently developing an interactive data website that allows users to explore sports accessibility across New York City and identify which neighborhoods are most underserved. We hope to develop better quantitative metrics to help policymakers highlight neighborhoods like Borough Park, where the need for future investment is most pressing, so that decisions about public athletic infrastructure can take into account the needs of underserviced neighborhoods in a quantifiable way.
Planetizen Federal Action Tracker
A weekly monitor of how Trump’s orders and actions are impacting planners and planning in America.
Eastern Nebraska is running out of electricity
Data centers and electrification are straining eastern Nebraska’s grid, throttling economic development.
Study reveals best places in the U.S. for cycling, walking
New research from Streetlight Data examines bicycle and pedestrian miles per capita in the 100 largest U.S. cities by population.

DSA members accuse Mamdani of 'abandoning values' over housing redevelopment
New York City's mayor plans to replace about 2,000 units of public housing with private, mixed-income housing.

All sides of BRT debate unhappy with CDOT’s most recent move
The Colorado Department of Transportation is no longer considering center-running bus lanes for Colorado Boulevard.

Massachusetts bogs generate both power, and cranberries
Putting solar panels above farmland is one way Massachusetts is advancing toward its goal of net-zero carbon emissions by 2050.

FREE Course: Walkable City 1: Why Walkability?
After describing his path towards focusing on walkability as the essence of good planning, Jeff Speck marches through his five principal reasons for making more walkable places.
Reinventing Malls: Planning Alchemy—Turning Gray Fields Into Gold
The course focuses on the opportunities and imperatives that shape reinvention of mall sites.

City of Rosemead
Rutgers University, Edward J. Bloustein School of Planning and Public Policy
One Hundred Miles
University of Michigan School for Environment and Sustainability (SEAS)
Hunter College, City University of New York (CUNY)
The Architects Foundation
City of Cambridge
The Pocatello Development Authority
The Urban Renewal Agency of the City of Pocatello

