Before a collapse in Georgia’s rural counties population, a decade of drops in per capita income lay the foundation for future trouble.



This story was originally published by The Daily Yonder as part of a multi-part series on rural Georgia’s population loss — a stark and poignant example of a deepening demographic crisis in rural America on the whole. Read the first part, “The Hollowing Out of Rural Georgia.”
Rural Georgia’s current demographic implosion didn’t happen overnight, or in a vacuum. Look behind headlines about the stunning number of counties reporting more deaths than births, and you’ll find an earlier economic signal that something was amiss: a breathtaking drop in per capita income (PCI) performance that began roughly a decade before rural Georgia hit its demographic tipping point.
The downturn in the state’s PCI performance was all the more startling because it followed at least 20 years of remarkable improvement. Between 1980 and 2000, Georgia’s average per capita income climbed from 84.5% of the national average to 95.1%, and it rose in rank among the 50 states from 38th to 25th. Only New Hampshire climbed further during that period.
But the dawn of the new millennium brought a downturn at least as remarkable as the earlier progress. There were, to be sure, external forces at work: the 9/11 attacks stalled the entire nation’s economy, and the dot-com bubble hit high-tech centers, including the Atlanta metro area, particularly hard. But neither those factors nor any other obvious forces explain the collapse of Georgia’s PCI performance.
The picture for rural Georgia is especially grim. While the PCI rates for the Atlanta MSA and the state as a whole have basically flatlined in recent years, rural Georgia has seen its PCI performance continue to drop.

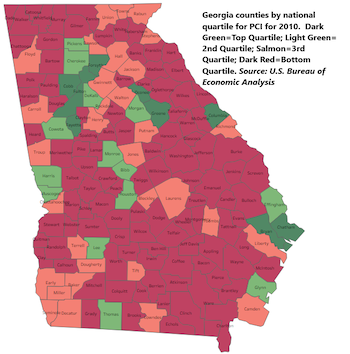
As of 2023, based on data from the U.S. Bureau of Economic Analysis (BEA), 104 of Georgia’s 159 counties — all but a handful rural and sparsely populated — were mired in the bottom national quartile for PCI. Those counties were home to 3.3 million Georgians, right at 30 percent of the state’s population. Only Texas, with three times Georgia’s population, had more of its residents living in the bottom quartile counties: 3.6 million.
Six of the bottom 20 counties on this unhappy list are Georgia counties, including Wheeler County at 3,113th out of 3,113 counties. No other state had more than two counties in the bottom 20.
Overall, between 2000 and 2020, Georgia’s PCI performance against the national average fell to 87.1 percent, and the state dropped in rank all the way back to 40th. A closer look suggests that the state was in some respects worse off 20 years into the 21st century than it had been 40 years earlier.
In 1980, 88 of Georgia’s 159 counties ranked in the bottom national quartile for PCI performance, according to BEA data, and those counties were home to 21 percent of the state’s population.
Twenty years later, the number of Georgia counties languishing in that bottom national quartile had been cut to 53, nearly all rural; only four had populations of more than 30,000 people. The portion of the state’s population living in those counties was down to 8.8 percent, close to the national average.
 Georgia almost certainly would have done even better during this period but for NAFTA. The North American Free Trade Agreement took effect on January 1, 1994, and had an almost immediate effect on manufacturing plants and jobs across rural America, including rural Georgia.
As this graph below shows, PCI in the 130 counties outside the current 29-county Atlanta Metropolitan Statistical area (MSA) had been rising steadily, if slowly, since 1980, climbing from 73.2% of the national average that year to a peak of 80.3% of the national average in 1995. At that point, it started a five-year slide to 75.5% in 2000 before bouncing back a bit and then tumbling again. If these 130 counties outside the Atlanta MSA constituted a standalone state, its average PCI in 2023 would have been the lowest in the nation, below that of Mississippi.
The Atlanta MSA, meanwhile, enjoyed robust PCI growth through the early 1980s, all but ignoring the so-called “double-dip” recessions of 1980 and then 1981-82, before plateauing in the mid-‘80s and tailing off in the latter half of the decade. The region (and indeed the state as a whole) got back on a growth track in the 1990s, powered in part by Atlanta’s winning bid for the 1996 Olympics. As the graph above shows, the Atlanta MSA’s PCI peaked at just over 110 percent of the national average between 1999 and 2001.
But then, with the dawn of the 21st century, came a series of economic body-blows that sent PCI performance for the Atlanta MSA and the state as a whole into freefall: 9/11, the dot-com bubble in 2001, and finally the Great Recession in 2007. But those factors were national in effect, and the reasons for Georgia’s disproportionately poor performance remain unclear.

It’s impossible to ignore the fact that the reversal in Georgia’s PCI performance coincided with the Republican takeover of Georgia’s state government. Governor Sonny Perdue, who defeated incumbent Democratic Governor Roy Barnes in 2002 to become the first GOP governor of Georgia in more than a century, presided over the biggest drop in PCI performance in modern times, if not ever. By the time Perdue left office at the end of 2010, the number of counties in the bottom national quartile had nearly doubled to 104, and the percentage of the state’s population living in those counties had more than tripled.
A close review of the PCI performance of Georgia’s neighboring states — Alabama, Florida, North Carolina, Tennessee, and South Carolina — suggests that regional forces were at work when Perdue took office. All five neighboring states suffered drops in PCI performance that coincided roughly with Georgia’s, but none were as deep or lasted as long.
The Fiscal Research Center at Georgia State University produced a policy brief on the problem, noting in 2009 that Georgia “ranked 50th in the nation in per capita income growth.” Two years later, as Perdue’s successor, U.S. Representative Nathan Deal, was preparing to take office as the state’s new governor, a former head of the state’s economic development agency, George Berry, wrote an impassioned column in Georgia Trend imploring Deal to focus on revitalizing the state’s PCI performance.
 Berry had served as commissioner of the Department of Industry, Trade & Tourism (now named Economic Development) under Governor Joe Frank Harris in the 1980s and had pursued growth strategies aimed at elevating per capita income.
“The new governor and his team should keep before them one great criterion,” Berry wrote. ‘How will what we do move Georgians toward 100 percent of the national average per capita income?’ This can inform almost all decisions, even social policy …
“If our new governor can improve this vital statistic, he will be assured of a successful administration,” Berry added. “Because it is a measure easily calculated, everyone can keep score. It is in all of our best interests that Governor Deal be the one to celebrate that day when Georgia finally achieves 100 percent of the national average per capita income.”
Deal may have been listening. The state’s PCI performance bottomed out at 84.2% of the national average in 2012, his second year in office, and began a slow uphill crawl that peaked at 87.9% of the national average in 2017. That wasn’t much of an improvement, but at least the situation hadn’t gotten worse.
Deal’s successor, Governor Brian Kemp, has scored major economic development wins that may well prove to be transformative in two largely rural areas of Georgia: the $7.5 billion Hyundai Motor Group Metaplant in deep southeast Georgia and a $5 billion Rivian factory planned for construction starting next year, about an hour east of Atlanta. These plants and several new battery plants in Georgia could well make the state a key player in the nation’s emerging EV industry.
But Kemp nonetheless seems to be presiding over yet another decline in PCI performance, albeit a slow one. When Kemp took office in 2019, the state’s PCI stood at 87.3% of the national average; since then, it’s been dropping steadily, if slowly, and now stands at 86.3%. Among the 50 states, Georgia now ranks 41st, its lowest position in more than four decades.
Cause and effect are always difficult to prove in situations like this, but in this case, one lesson seems clear: periods of dramatic change are rarely the result of a single event or decision. In Georgia’s journey, prosperity and setback have alternated, sometimes for reasons visible in the headlines, sometimes for causes discernible only in data (and then only in retrospect). The state’s future, and that of rural communities in particular, may well depend on how leaders — and citizens — respond to the realities reflected in these numbers.
All data charts and maps were sourced from the U.S. Bureau of Economic Analysis.
Charles Hayslett, is the author of the long-running Trouble in God’s Country blog, which focuses largely on the costs and consequences of the death of rural Georgia.


The Hollowing Out of Rural Georgia
America’s rural population is declining for the first time in history. In Georgia, it amounts to a demographic crisis.

Without International Immigrants, the Rural US Population Would Be Falling 58%
Census data shows that population growth in rural areas is due in large part to international migrants.

Rural Population Grew Again in 2024
Americans continued to move to smaller towns and cities, resulting in a fourth straight year of growth in rural areas.

Planetizen Federal Action Tracker
A weekly monitor of how Trump’s orders and actions are impacting planners and planning in America.

The state-sanctioned urbicide of Austin
People don’t kill cities. Freeways do.

US to reduce Colorado River water deliveries to Mexico
A new Colorado Treaty amendment reduces Mexico’s Colorado River water allocation by 250,000 acre feet.

5 New England states march closer to 800 megawatt wind energy project
Securing federal approval for the project may be complicated under the Trump administration, which has historically been hostile towards domestic wind power.

Baltimore to break ground on $50 million Transit Priority Project
The project will bring faster bus trips, safer streets and better bike connections to Baltimore.

Airbnb launches $250 million 'last-dollar financing' housing accelerator, makes first investment in Austin
The company will put $6.4 million towards affordable housing development in Texas’ capital.

FREE Course: Walkable City 1: Why Walkability?
After describing his path towards focusing on walkability as the essence of good planning, Jeff Speck marches through his five principal reasons for making more walkable places.
Reinventing Malls: Planning Alchemy—Turning Gray Fields Into Gold
The course focuses on the opportunities and imperatives that shape reinvention of mall sites.

Eagle County Government
Harvard University Graduate School of Design
Nashville Planning Department
The Architects Foundation
University of Cincinnati Online
The Pocatello Development Authority
The Urban Renewal Agency of the City of Pocatello
Journal of the American Planning Association

