


Besides wasting billions of taxpayer dollars, road-building may actually be holding back economic growth overall.

University of Minnesota professor David Levinson has written in the past that, because of the relative completeness of our national highway network and the cost of construction, the return on investment for additional mileage is approaching zero. One study estimates the return on investment for highway construction was just 14% between 1990 and 2000.
I recently decided to follow up on this line of research, so I dug through some Census data. What I found was shocking, though not altogether surprising. It seems that, besides wasting billions of taxpayer dollars, road-building may actually be holding back economic growth overall: from roughly 2000 to 2010, states that built the fewest urban road miles grew an average of 64 to 94 percent faster than their asphalt-enamored neighbors. Rather than increasing productivity through increased mobility and reduced congestion, as politicians and lobbyists so often promise, all this mindless road-building could be depressing statewide economic growth!
Between 1998 and 2009 the United States accumulated 144,425 additional miles of roadway — 239,728 miles of new urban roads, offset by the loss of 95,303 miles of rural roads. Over roughly the same time frame (2000-2010, the years for which data was readily available), the US saw an 8.15% increase in per-capita income. Official statistical abstracts also break this data down state by state: [Roads, 1998] - [Roads, 2009] - [Income, 2000-2010]. (Scroll to the bottom to find a table with relevant data for each state. I also have an Excel file with additional data; readers interested in a more complete data-set can request this via email or Twitter.)
The statistics at the state level vary widely for both road-building and income growth:
- Changes in urban road mileage ranged from -0.45% (Alabama) to +68.21% (West Virginia);
- Changes in per-capita income ranged from -3.53% (Nevada) to +41.78% (Washington, DC).
Looking at the numbers in aggregate, we see some interesting trends that seem to hold up just about any way you slice the pie:
- States that increased their urban road mileage by less than 30% grew by an average of 14.40%, while those that increased mileage by greater than 30% grew by an average of just 8.77%.
- If we set the cutoff at 20% mileage growth, states that built less grew by 17.97%, and states that built more grew by 9.24%.
- At a 10% cutoff, states that built less grew by an impressive 20.70%, compared to just 10.66% for those that built more.
Statistically, analyzing the correlation between road-building and economic growth gives us an r-score (correlation coefficient) of -0.34, which implies that about 10% of a given state's economic growth can be explained by how much urban road-building they did over this time period. Many things influence the overall health of any economy, obviously, so we shouldn't expect the quantity of roads to wholly predict statewide economic growth by itself, but this does indicate a negative correlation between the two variables: more roads equals less growth. (As always, please remember that correlation does not imply causation.)
Here's a graph of road-building versus economic growth, complete with the down-sloping trend line:
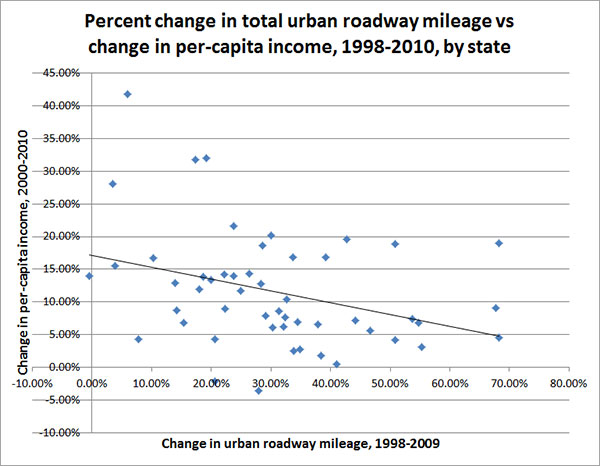
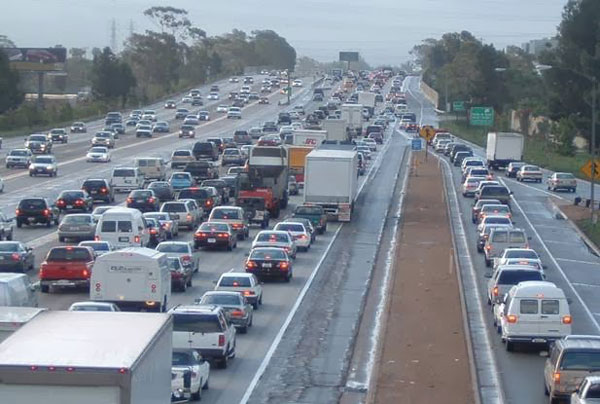
None of this should be particularly surprising. While politicians and advocates love to tout the job-creating value of new road and highway capacity, congestion reduction rarely lasts more than five years and widened roads ultimately only succeed in extending the boundaries of wasteful, unproductive sprawl. In the case of road widenings, it's entirely possible that the disruption caused during the construction phase completely erases — or even exceeds — the fleeting benefits of reduced congestion.
Then there's the opportunity cost: think of all the good that could have been done with the hundreds of billions of dollars spent on roadways over that period: more responsible transportation spending, education, renewable energy ... take your pick.
Washington, DC, which grew its urban road network by just 5.91% over this 11-year period but managed a best-in-class 41.78% growth rate, doesn't have to imagine.
Table: Changes in urban roadway mileage and per-capita income, by state:
| State | Change in urban roadway mileage | % change | Change in per-capita income | % change |
|---|---|---|---|---|
| Alabama | -94 | -0.45% | 3,739 | 13.95% |
| Alaska | 609 | 33.65% | 5,747 | 16.90% |
| Arizona | 5,599 | 32.33% | 2,245 | 7.67% |
| Arkansas | 2,857 | 28.60% | 4,686 | 18.63% |
| California | 6,508 | 7.79% | 1,590 | 4.28% |
| Colorado | 5,375 | 38.39% | 674 | 1.78% |
| Connecticut | 3,420 | 29.13% | 3,705 | 7.93% |
| Delaware | 1,009 | 50.86% | 1,426 | 4.13% |
| District of Columbia | 84 | 5.91% | 18,842 | 41.78% |
| Florida | 32,704 | 67.66% | 2,952 | 9.11% |
| Georgia | 11,238 | 41.06% | 159 | 0.50% |
| Hawaii | 445 | 23.75% | 4,536 | 14.01% |
| Idaho | 1,828 | 46.69% | 1,536 | 5.59% |
| Illinois | 5,528 | 15.40% | 2,489 | 6.85% |
| Indiana | 6,919 | 34.84% | 860 | 2.81% |
| Iowa | 1,891 | 19.98% | 4,050 | 13.32% |
| Kansas | 2,852 | 28.29% | 4,042 | 12.74% |
| Kentucky | 1,560 | 14.15% | 2,403 | 8.70% |
| Louisiana | 2,410 | 17.30% | 8,346 | 31.79% |
| Maine | 367 | 13.96% | 3,832 | 12.89% |
| Maryland | 3,154 | 22.16% | 5,490 | 14.21% |
| Massachusetts | 5,136 | 22.27% | 3,833 | 9.01% |
| Michigan | 6,123 | 20.59% | -703 | -2.15% |
| Minnesota | 5,055 | 32.10% | 2,248 | 6.19% |
| Mississippi | 3,102 | 39.15% | 4,056 | 16.90% |
| Missouri | 7,225 | 44.14% | 2,212 | 7.12% |
| Montana | 590 | 23.74% | 5,641 | 21.58% |
| Nebraska | 1,282 | 24.98% | 3,745 | 11.76% |
| Nevada | 1,590 | 27.93% | -1,219 | -3.53% |
| New Hampshire | 1,998 | 68.19% | 1,705 | 4.49% |
| New Jersey | 7,345 | 30.34% | 2,632 | 6.11% |
| New Mexico | 1,848 | 30.07% | 5,110 | 20.16% |
| New York | 7,607 | 18.63% | 5,363 | 13.90% |
| North Carolina | 12,777 | 55.34% | 980 | 3.15% |
| North Dakota | 64 | 3.49% | 7,993 | 28.00% |
| Ohio | 11,318 | 33.82% | 792 | 2.48% |
| Oklahoma | 5,616 | 42.68% | 5,370 | 19.60% |
| Oregon | 2,205 | 20.63% | 1,396 | 4.36% |
| Pennsylvania | 11,164 | 32.70% | 3,496 | 10.42% |
| Rhode Island | 484 | 10.29% | 5,478 | 16.68% |
| South Carolina | 5,814 | 54.81% | 1,908 | 6.83% |
| South Dakota | 1,007 | 50.88% | 5,540 | 18.82% |
| Tennessee | 6,067 | 34.49% | 2,044 | 6.88% |
| Texas | 14,831 | 18.02% | 3,792 | 11.94% |
| Utah | 3,898 | 53.78% | 2,025 | 7.42% |
| Vermont | 53 | 3.87% | 4,861 | 15.48% |
| Virginia | 4,967 | 26.38% | 5,041 | 14.30% |
| Washington | 5,538 | 31.37% | 3,108 | 8.61% |
| West Virginia | 2,176 | 68.21% | 4,676 | 18.93% |
| Wisconsin | 6,149 | 37.88% | 2,130 | 6.56% |
| Wyoming | 436 | 19.15% | 10,448 | 32.04% |

Georgia's $11 Billion Road-Building Program Evolves
Recently announced changes to a massive road-building program in Georgia will shift moves projects aimed at improvements for the trucking industry earlier onto the calendar, while pushing back projects located closer to Atlanta.
Texas Approves Plan that Calls for $104B for Roads and Highways
The latest iteration of Texas’s 10-year unified transportation plan sets a record for highway spending in the state.

Maine Mobility Advocates Question Highway Expansion
State transportation officials say a proposed road expansion project would reduce congestion — if coupled with transit initiatives.

Planetizen Federal Action Tracker
A weekly monitor of how Trump’s orders and actions are impacting planners and planning in America.

Congressman Proposes Bill to Rename DC Metro “Trump Train”
The Make Autorail Great Again Act would withhold federal funding to the system until the Washington Metropolitan Area Transit Authority (WMATA), rebrands as the Washington Metropolitan Authority for Greater Access (WMAGA).

The Simple Legislative Tool Transforming Vacant Downtowns
In California, Michigan and Georgia, an easy win is bringing dollars — and delight — back to city centers.

The States Losing Rural Delivery Rooms at an Alarming Pace
In some states, as few as 9% of rural hospitals still deliver babies. As a result, rising pre-term births, no adequate pre-term care and "harrowing" close calls are a growing reality.

The Small South Asian Republic Going all in on EVs
Thanks to one simple policy change less than five years ago, 65% of new cars in this Himalayan country are now electric.

DC Backpedals on Bike Lane Protection, Swaps Barriers for Paint
Citing aesthetic concerns, the city is removing the concrete barriers and flexposts that once separated Arizona Avenue cyclists from motor vehicles.
Urban Design for Planners 1: Software Tools
This six-course series explores essential urban design concepts using open source software and equips planners with the tools they need to participate fully in the urban design process.
Planning for Universal Design
Learn the tools for implementing Universal Design in planning regulations.
Smith Gee Studio
City of Charlotte
City of Camden Redevelopment Agency
City of Astoria
Transportation Research & Education Center (TREC) at Portland State University
US High Speed Rail Association
City of Camden Redevelopment Agency
Municipality of Princeton (NJ)