


The lack of adequate pedestrian behavior models means that designing for walkability has largely remained a matter of intuition. However, agent-based simulation can provide insight into the keys for creating pedestrian-friendly places.
Currently, much planning research focuses on the issue of walkability: its definition, its elements and its merits. Neighbourhood layout is judged as a crucial factor in enabling walkability or, put in mobility terms, pedestrian traffic. For car traffic there are several sophisticated computer models that predict traffic volumes, average speeds, delays, choke points, congestion and even the probability of collisions based on network layout, accepted trip generation assumptions and documented driver behaviour. An intersection doesn’t have to be built to know if it’s dangerous.
Pedestrian traffic is, however, often neglected in such models. Pedestrian traffic is either not explicitly simulated (i.e.models simply teleport pedestrians to their destinations) or assigned static routes with no consideration of traffic conditions. The social aspects of pedestrian trips, such as preferred routes and possible social encounters, are rarely considered. Thus, layout decisions are based mostly on built examples and the observed behaviour of people in them, as recorded on site or through personal travel diaries.
As each built neighbourhood comes with its own idiosyncratic design elements, generalization is risky. There is no room for experimentation with the physical environment either. Consequently, designing for walkability largely remains a matter of intuition.
A New, Promising Design Tool
A relative newcomer in the field of modelling behaviour patterns - agent-based simulation - can empower planners to go beyond intuition and predict the outcomes of design decisions at the neighbourhood scale in surprising detail. In addition, it allows “what if” explorations, testing planning scenarios and implementations with ease.
The strength of agent-based modelling lies in its ability to deal with processes which are non-linear and which involve many interacting factors and feedback loops. These aspects are normal characteristics of complex systems, such as cities and their neighbourhoods.
For example, traffic patterns are the collective outcomes of individual residents’ route and mode choices, but traffic patterns also influence choice behaviour, because people will judge the feasibility of a choice based on perceived road and traffic conditions. Agent-based models directly simulate the behaviour of individual residents (agents) and the bottom-up formation of traffic patterns. This type of analysis is dynamic and closely resembles real life processes.
Agent-based modelling has been, and continues to be, used successfully in simulating highway traffic patterns and pedestrian movements within confined spaces such as rooms, buildings and parks. This study shows a first attempt in simulating both automobile and pedestrian traffic and the feedback interactions between them at the neighbourhood scale. Computing power, a thorough experimental set-up and fine calibration make it possible to test not only entire neighbourhoods but also zoom in on specific elements and examine their influence.
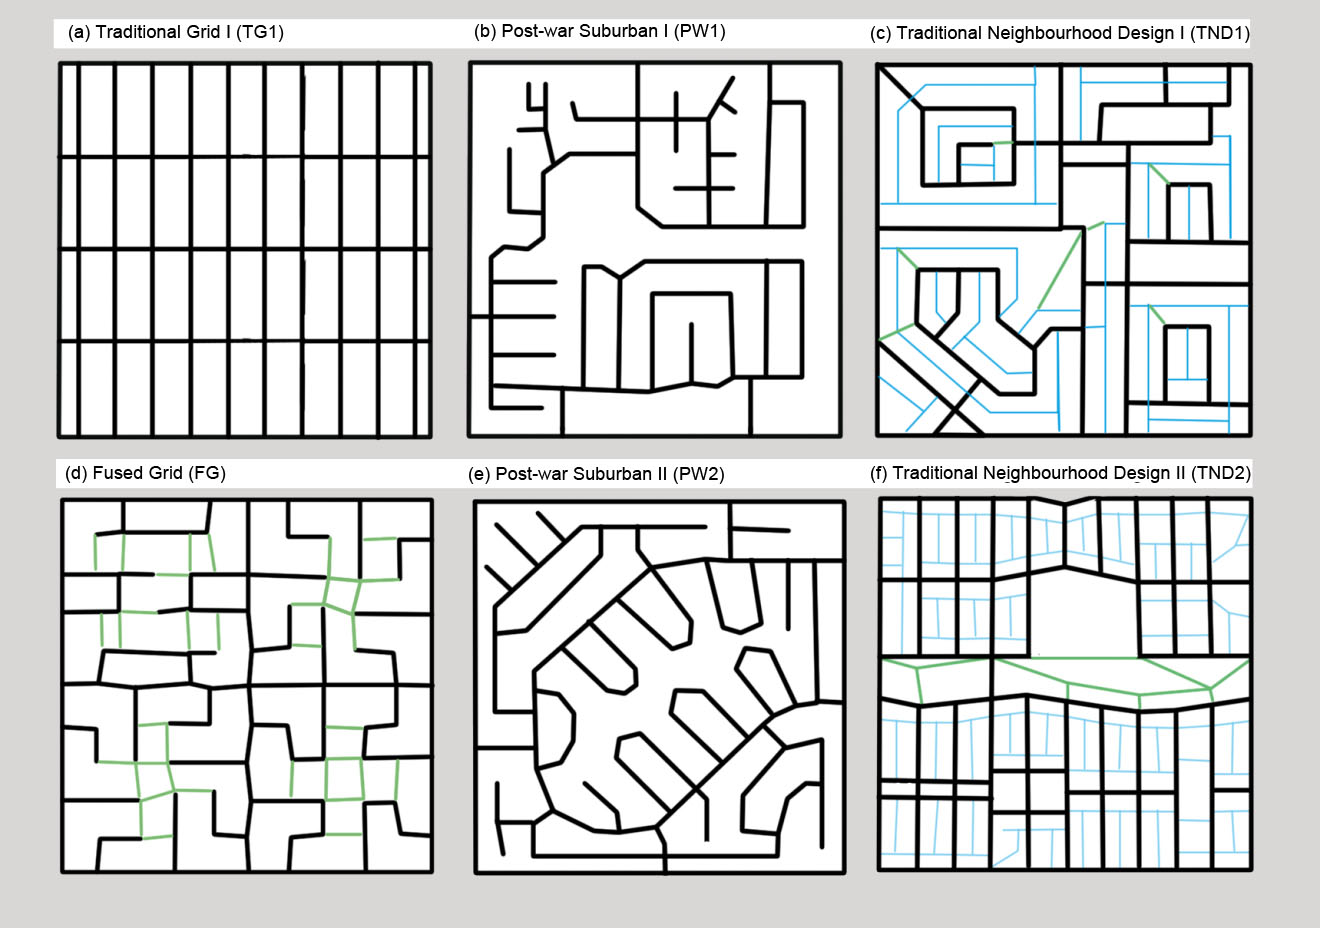
Figure 1: Six neighbourhood layout patterns found in contemporary subdivisions
Example Study: Learning from Trip Patterns in Seven Neighbourhoods
To gain needed insight into the influence of neighbourhood street layout on the choice of modes and the extent of their use, the study looked at seven typical layouts spanning the last 100 years of neighbourhood design (see Figure 1 with six of the seven layouts. The seventh layout is a grid with only one east-west street in the middle).
“Traditional Grid” (Figure 1a) represents the grids of historic cities that were conceived and applied in eras when walking, horses, carts and streetcars were the common means of transport.
The postwar suburban expansion layouts (Figures 1b and 1e, roughly based on two neighbourhoods from Richmond, BC: 1b, 1e) presume the existence of and accommodate the private car. One common characteristic that clearly distinguishes them from the grid that preceded them is the hierarchical, dendrite structure in juxtaposition to the uniform, open structure of the grid.
Two more layouts (Figures 1c and 1f, roughly based on two neighbourhoods from Calgary, AB and Denver, CO: 1c, 1f) represent the Traditional Neighbourhood Design (TND) approach. It departs from the simple grid, by shedding its uniformity and by including some hierarchy. It avoids the predominance of 4-way intersections, but retains its rectilinearity. The postwar suburban and TND designs presented here account for only a miniscule fraction of a wide range of designs, many of which are highly idiosyncratic and site specific.
The seventh layout, the “Fused Grid”, represents a recent synthesis of the conventional suburban and the grid layouts. It combines the orthogonal geometry of the grid, without its uniformity, and the hierarchy of the suburban patterns without being dendrite. It also limits the number of 4-way intersections as both the TND and the post-war layouts do.
Note that the Google Maps links provided above are for illustrative purpose only. The layouts used in this study contain many modifications to the original layouts, and are used in experimental settings with population, density, facility locations and other characteristics that may be completely different from those real-world neighbourhoods. Thus the generated mode split and traffic patterns should not be interpreted as representative of the actual patterns in these neighbourhoods, and in fact may be significantly different.
To exclude the influence of variables other than network configuration and make the layouts comparable to each other, all seven layouts were set to be 800 × 800 metres (approximately half a mile by half a mile) in area, with local facilities and exits identically located at the four corners of the neighbourhoods. For the experiments below, population density was set to 16.2 households or 33 persons per hectare, a medium-level density for suburban neighbourhoods, but other densities were also tested. A detailed description of the parameters can be found by following the link at the end of this article.
To evaluate the layouts, a customized simulation model was developed using the Java programming language, based on the Repast Simulation Toolkit and OpenMap GIS Toolkit.
The Results
The agent-based model, which was calibrated against observed trip and traffic data and then applied to the seven layouts, produced many instructive and some surprising results that run counter to accepted assumptions.
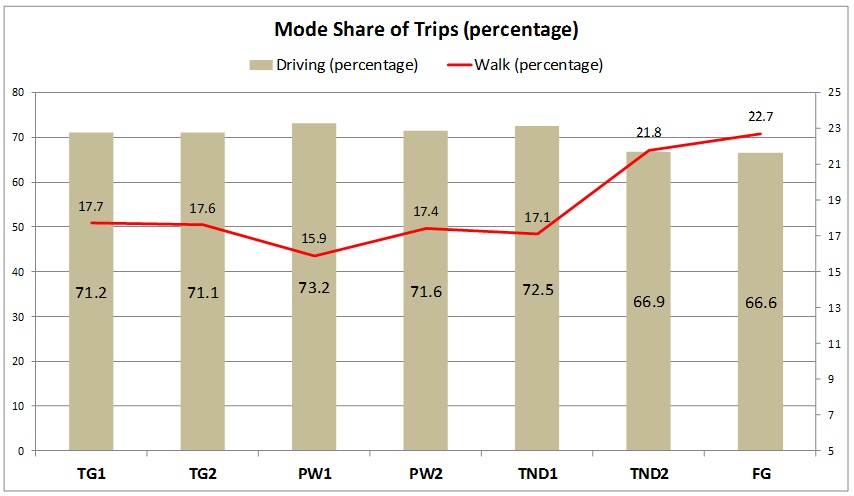
Figure 2: Mode share of trips (percentage)
Pedestrian trips
The walking share of trips ranges from 15.9% (lowest) to 22.7% (highest) among the seven neighbourhoods representing a rise of 6.8 percentage points, or a 43% increase. The highest percentages are achieved by the TND2 and Fused Grid layouts. The similarity of results between PW2 and TND1 layouts shows the importance of implementation. The grid-based design (TND2) is very effective in increasing walk share, while the loop-based TND1 is entirely ineffective. Expectedly, the two plans that produce the highest walk shares also result in the lowest drive shares, which overall fall by 6.5 percentage points, mirroring the 6.4 point rise in walk shares.
Intersection density
This analysis puts in doubt one of the central design elements thought responsible for improving walkability – high street intersection density.
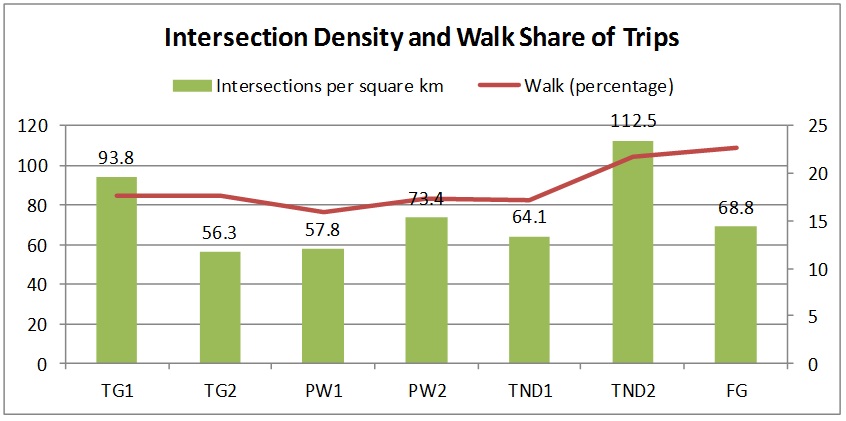
Figure 3: Intersection density and walk share of trips
As shown in Figure 3, the two traditional grids (TG1, TG2) with a 67% difference in their intersection density produce identical walk shares. Similarly, the difference between PW1 and PW2 in intersections is 27% and in walk share is 9%. More challenging is the 64% difference in intersection density between the two patterns that produce the highest, and about equal, walk shares – the TND2 and the Fused Grid layouts. It would seem that other factors have much greater influence on the walk share than the number of intersections. What are they?
The role of Pedestrian-Only Routes (PORs)
At first glance, it would appear that PORs may provide the clue to the pedestrian mode share increase because they provide more direct routes to destinations. Both the TND2 and the Fused Grid, which achieve high shares of walk trips, have a higher number of paths than all other layouts. Scenario testing proved this hunch to be true. By adding or removing PORs and then replacing those with normal roads the results show their importance in clearly observable trends.
When PORs are available or made available the pedestrian trip share increases significantly (with one exception) and when PORs become regular roads the share drops (without exception). These differences are most pronounced with the fused grid layout, where the share drops by 24% when the paths are removed and by 18% when they are turned into roads.
The drop of walk share when paths are turned into roads may be telling a different story: that pedestrians would rather walk on paths meant exclusively for them. This point is also reinforced by the walk share difference between TG1 (17.7%) and the fused grid (22.7%) in light of the fact that TG1 has about 36% higher intersection density, which offers more route options.
Where people walk and meet
Pedestrian-only routes are attractive for providing more direct access to destinations, much lower exposure to automobile emissions, and good social interaction opportunities. Pedestrian-only routes that are provided at strategic locations, for example near the centre of the neighbourhoods as in the Fused Grid and the TND2 designs, prove to be successful in increasing pedestrian mode share and also providing grounds for increased social encounters.
Adding or removing PORs significantly changes where people walk and meet (Figure 4, green lines represent PORs and red squares show places where pedestrians encounter each other). With PORs provided at suitable locations, even pedestrians in post-war suburban designs can enjoy environments better suited to social interaction. Factors such as facility locations have significant influences as well.
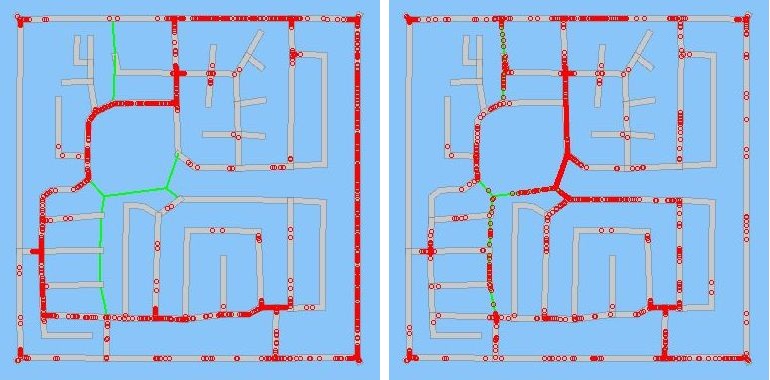
Figure 4: Where people walk and meet without (left) and with (right) PORs
The influence of density
An additional experiment tested the influence of density on walk shares. From a low of 10 units per hectare to a high of 30 units per hectare in increments of five, the simulations show that density alone has insignificant influence on the walk share of trips. In all seven plans the difference in walking between the lowest and highest density scenarios is between 0.5 to 1.7 percentage points and there is no clear trend. It confirms the results of previous studies which show that diversity of uses, rather than density alone, is a necessary condition to achieve high rates of walking.
Agent-Based Modeling as a Tool for Neighbourhood Design
The agent-based model proves to be a powerful and flexible tool. In the field of neighbourhood layout design it could advance the practice, which is now based on intuition and on limited, retrospective studies.
By utilizing such a model, this study shows that neo-traditional and fused grid designs are generally more pedestrian-friendly, with fewer crossings, shorter walking distance to facilities, less traffic and pollution exposure, and more social interaction opportunities for pedestrians. And experiments with the provision of pedestrian-only paths shows that increasing road and intersection density seems to matter much less to walkability than increasing such paths.
Given the complex nature of traffic patterns and travel behaviour, the craft of drawing lines on paper must be accompanied by “experiments” of their outcome, if they are to achieve their intended goals after implementation. This tool offers the opportunity to do such experiments and gain confidence in relationships between design and outcomes. These results, by raising questions about certain widely accepted assumptions, show the importance of studying urban neighbourhoods as complex systems, and the importance of thorough analysis of any urban design decisions based on the complex system approach.
Xiongbing Jin specializes in agent-based simulation of complex systems with research in both social and natural systems such as land use, transportation and forest ecosystem. He can be reached at xiongbing (at) live.com. This article introduces selected results from his PhD thesis. The full thesis is available at http://search.proquest.com/pqdtlocal1006891/docview/918703093/abstract (library subscription required) or can be requested by email.
Fanis Grammenos is a principal of Urban Pattern Associates and was a Senior Researcher at Canada Mortgage and Housing Corporation for over 20 years. He focused on housing affordability, building adaptability, municipal regulations, sustainable development and, recently, on street network patterns. Prior to that he was a housing developer. He holds a degree in Architecture from the U of Waterloo.


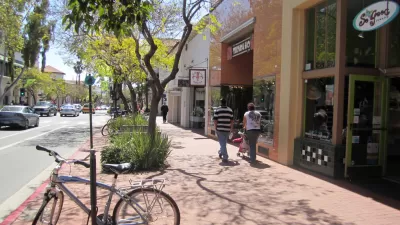
Walkability 'Growing Pains' in Los Angeles
By many estimates, a city known for its pedestrian unfriendliness is developing pockets of local walkability. Minor disputes over pedestrian rights may add up to something bigger.
Florida Backs Miami Complete Streets Initiative
The Florida DOT has approved Miami's plan to rework busy Biscayne Boulevard. In the spirit of Complete Streets, vehicle lanes will be reduced and pedestrian/bike spaces expanded.
To Become a "Great City", Miami Seeks to Boost Pedestrian-Friendliness
With the housing bust of the Great Recession fading in the rear-view mirror, a maturing Miami aspires to become one of the world's great cities. City leaders see the creation of a "Downtown Pedestrian Priority Zone" as the path to get them there.

Planetizen Federal Action Tracker
A weekly monitor of how Trump’s orders and actions are impacting planners and planning in America.

Restaurant Patios Were a Pandemic Win — Why Were They so Hard to Keep?
Social distancing requirements and changes in travel patterns prompted cities to pilot new uses for street and sidewalk space. Then it got complicated.

Maui's Vacation Rental Debate Turns Ugly
Verbal attacks, misinformation campaigns and fistfights plague a high-stakes debate to convert thousands of vacation rentals into long-term housing.

In California Battle of Housing vs. Environment, Housing Just Won
A new state law significantly limits the power of CEQA, an environmental review law that served as a powerful tool for blocking new development.

Boulder Eliminates Parking Minimums Citywide
Officials estimate the cost of building a single underground parking space at up to $100,000.

Orange County, Florida Adopts Largest US “Sprawl Repair” Code
The ‘Orange Code’ seeks to rectify decades of sprawl-inducing, car-oriented development.
Urban Design for Planners 1: Software Tools
This six-course series explores essential urban design concepts using open source software and equips planners with the tools they need to participate fully in the urban design process.
Planning for Universal Design
Learn the tools for implementing Universal Design in planning regulations.
Heyer Gruel & Associates PA
JM Goldson LLC
Custer County Colorado
City of Camden Redevelopment Agency
City of Astoria
Transportation Research & Education Center (TREC) at Portland State University
Jefferson Parish Government
Camden Redevelopment Agency
City of Claremont