


New neighborhood-level data from the walkability rating website Walk Score has broadened the view of what it means to live in a walkable city.
Over the past few years, the website Walk Score has gained a lot of popularity amongst urban planners, developers and, maybe most especially, real estate agents. It's a mapping tool that quantifies the walkability of street addresses with a simple 0-100 score, based on proximity to a variety of amenities. It's an easy way to find a new place to live, or to navel-gaze and see just how well your address measures up.
It's also a good way to compare places. In 2008, the site released citywide Walk Scores for 40 cities, aggregating scores from addresses throughout cities to give average scores across entire urban areas. "Top 10" lists inevitably ensued. As with many of these sorts of lists, the value is mainly in the novelty, but these figures do well to illustrate how cities differ on a macro scale.
Enter the micro scale.
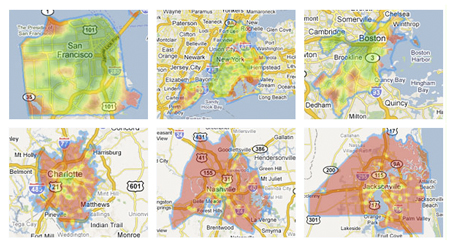
A new release of data has created scores for more than 2,500 cities in the U.S., and, most importantly, the scores of more than 6,000 neighborhoods within these cities. The site has released a number of "heat maps" that show, through a red-to-green color overlay, where the highest and lowest Walk Scores are within a city. The maps are pretty cool to look at, as are these side-by-side heat maps.
This neighborhood-level data is important because it offers a more precise look at just how walkable a city is. A citywide Walk Score of 50 might seem fine, but how many neighborhoods and areas within that city actually scored just a 2 or a 3? Neighborhood-level scores allow people to look at a city and see not only a generally walkable place, but specific walkable areas within that place.
And, now, with all this additional data, let the Top 10 lists emerge yet again. I'll start, though I'm trying to get a slightly broader view. In the following tables and lists, I look at the 40 most populous cities in the U.S. (based on 2009 data from the U.S. Census Bureau), comparing both their citywide Walk Score averages and their neighborhood-level scores.
But before the listing begins, it must be stated that this data is by no means perfect. Not every neighborhood from every city is listed. Some cities have very few neighborhoods listed (Fresno, California, for example, has just four neighborhood Walk Scores) and others have more than 100 (San Antonio, Texas, has the most, with 230 listed). Also, three cities were divided by ZIP codes rather than neighborhoods. What defines a "neighborhood" is rather amorphous, so drawing clear comparisons between them across cities isn't exactly laboratory science. And Walk Score's method of assigning number scores is based on the proximity of amenities – another loose term that can be parks or elementary schools or bars. A bunch of bars might be desirable for some, but maybe less so for the parents of elementary school kids.
The data may be less than perfect, but for these purposes it offers a considerable amount of detail that is worth comparing.
Below is a list of the 40 most populous cities in the U.S., ranked by citywide Walk Score.
| City | Population | Citywide Walk Score |
| San Francisco | 815358 | 85 |
| New York | 8391881 | 84 |
| Boston | 645169 | 79 |
| Philadelphia | 1547297 | 74 |
| Chicago | 2851268 | 74 |
| Seattle | 616627 | 72 |
| Washington D.C. | 599657 | 71 |
| Portland | 566143 | 67 |
| Los Angeles | 3831868 | 67 |
| Long Beach | 462604 | 66 |
| Baltimore | 637418 | 65 |
| Denver | 610345 | 64 |
| Milwaukee | 605013 | 60 |
| San Diego | 1306300 | 56 |
| San Jose | 964695 | 55 |
| Las Vegas | 567641 | 54 |
| Sacramento | 466676 | 54 |
| Atlanta | 540922 | 53 |
| Fresno | 479918 | 52 |
| Omaha | 454731 | 52 |
| Albuquerque | 529219 | 52 |
| Austin | 786386 | 51 |
| Houston | 2257926 | 51 |
| Columbus | 769332 | 51 |
| Detroit | 910921 | 51 |
| Tucson | 543910 | 50 |
| Dallas | 1299542 | 49 |
| Phoenix | 1593659 | 49 |
| Mesa | 467157 | 47 |
| San Antonio | 1373668 | 44 |
| Louisville | 566503 | 43 |
| Fort Worth | 727577 | 43 |
| Kansas City | 482299 | 42 |
| El Paso | 620456 | 42 |
| Oklahoma City | 560333 | 42 |
| Indianapolis | 807584 | 41 |
| Memphis | 676640 | 41 |
| Nashville | 605473 | 39 |
| Charlotte | 704422 | 39 |
| Jacksonville | 813518 | 36 |
The following table offers a bit more detail on top of the last. By comparing all 2,621 Walk Scores at the neighborhood level in these 40 cities, I've come up with an average Walk Score for neighborhoods: 54.71. This is pretty close to the average Walk Score based on citywide scores: 55.17. Using the neighborhood-level average of 54.71, I then looked at each city to see how many of its neighborhoods scored above the average. Below is a ranking of cities that have the highest percentage of neighborhoods with Walk Scores above the neighborhood-level average.
| City | Population | Citywide Score | Percentage of Neighborhoods Above the Average Score (54.71) |
| San Francisco | 815358 | 85 | 100% |
| Boston | 645169 | 79 | 100% |
| Philadelphia | 1547297 | 74 | 96% |
| New York | 8391881 | 84 | 94% |
| Washington D.C. | 599657 | 71 | 91% |
| Chicago | 2851268 | 74 | 89% |
| Denver | 610345 | 64 | 85% |
| Seattle | 616627 | 72 | 83% |
| Portland | 566143 | 67 | 79% |
| Long Beach | 462604 | 66 | 79% |
| Los Angeles | 3831868 | 67 | 78% |
| Fresno* | 479918 | 52 | 75% |
| Austin | 786386 | 51 | 67% |
| Baltimore | 637418 | 65 | 61% |
| Atlanta | 540922 | 53 | 59% |
| Tucson | 543910 | 50 | 59% |
| San Diego | 1306300 | 56 | 58% |
| Houston | 2257926 | 51 | 56% |
| San Jose | 964695 | 55 | 56% |
| Omaha^ | 454731 | 52 | 56% |
| Columbus | 769332 | 51 | 56% |
| Milwaukee | 605013 | 60 | 52% |
| Louisville | 566503 | 43 | 52% |
| Las Vegas | 567641 | 54 | 52% |
| Albuquerque | 529219 | 52 | 50% |
| Sacramento | 466676 | 54 | 50% |
| Dallas | 1299542 | 49 | 50% |
| Detroit | 910921 | 51 | 40% |
| Mesa* | 467157 | 47 | 33% |
| Nashville | 605473 | 39 | 32% |
| Kansas City | 482299 | 42 | 30% |
| Phoenix | 1593659 | 49 | 30% |
| El Paso | 620456 | 42 | 28% |
| Charlotte | 704422 | 39 | 23% |
| Oklahoma City^ | 560333 | 42 | 21% |
| San Antonio | 1373668 | 44 | 19% |
| Jacksonville | 813518 | 36 | 13% |
| Fort Worth | 727577 | 43 | 12% |
| Indianapolis^ | 807584 | 41 | 7% |
| Memphis* | 676640 | 41 | 0% |
* denotes cities with very little neighborhood-level data, which makes their resulting rank possibly inaccurate.
^ denotes cities which were divided by ZIP Codes rather than neighborhoods.
The following table is a match-up of the cities from both of the previous tables.
| City, by Citywide Walk Score | City, by Percentage of Neighborhoods Above the Average Score (54.71) |
| San Francisco | San Francisco |
| New York | Boston |
| Boston | Philadelphia |
| Philadelphia | New York |
| Chicago | Washington D.C. |
| Seattle | Chicago |
| Washington D.C. | Denver |
| Portland | Seattle |
| Los Angeles | Portland |
| Long Beach | Long Beach |
| Baltimore | Los Angeles |
| Denver | Fresno* |
| Milwaukee | Austin |
| San Diego | Baltimore |
| San Jose | Atlanta |
| Las Vegas | Tucson |
| Sacramento | San Diego |
| Atlanta | Houston |
| Fresno | San Jose |
| Omaha | Omaha^ |
| Albuquerque | Columbus |
| Austin | Milwaukee |
| Houston | Louisville |
| Columbus | Las Vegas |
| Detroit | Albuquerque |
| Tucson | Sacramento |
| Dallas | Dallas |
| Phoenix | Detroit |
| Mesa | Mesa* |
| San Antonio | Nashville |
| Louisville | Kansas City |
| Fort Worth | Phoenix |
| Kansas City | El Paso |
| El Paso | Charlotte |
| Oklahoma City | Oklahoma City^ |
| Indianapolis | San Antonio |
| Memphis | Jacksonville |
| Nashville | Fort Worth |
| Charlotte | Indianapolis^ |
| Jacksonville | Memphis* |
Looking at the cities in each list side-by-side gives what I think is a different, and slightly more specific, view of walkability in American cities.
Nate Berg is a contributing editor at Planetizen, and a freelance journalist based in Los Angeles. He's also on Twitter.


What the ‘Walk Score’ Misses
A popular walkability assessment omits key factors that impact different demographics and can direct development resources to already wealthy neighborhoods.

Another Fun Neighborhood Analysis Toy
A Trulia feature offers lots of interesting information about neighborhoods (or at least about how their residents perceive them).

Orlando Pledges to Improve Walkability
A city report highlights successes and failures in building safer transportation infrastructure and reducing VMT in 2023.

Planetizen Federal Action Tracker
A weekly monitor of how Trump’s orders and actions are impacting planners and planning in America.

Chicago’s Ghost Rails
Just beneath the surface of the modern city lie the remnants of its expansive early 20th-century streetcar system.

Amtrak Cutting Jobs, Funding to High-Speed Rail
The agency plans to cut 10 percent of its workforce and has confirmed it will not fund new high-speed rail projects.

Ohio Forces Data Centers to Prepay for Power
Utilities are calling on states to hold data center operators responsible for new energy demands to prevent leaving consumers on the hook for their bills.

MARTA CEO Steps Down Amid Citizenship Concerns
MARTA’s board announced Thursday that its chief, who is from Canada, is resigning due to questions about his immigration status.

Silicon Valley ‘Bike Superhighway’ Awarded $14M State Grant
A Caltrans grant brings the 10-mile Central Bikeway project connecting Santa Clara and East San Jose closer to fruition.
Urban Design for Planners 1: Software Tools
This six-course series explores essential urban design concepts using open source software and equips planners with the tools they need to participate fully in the urban design process.
Planning for Universal Design
Learn the tools for implementing Universal Design in planning regulations.
Caltrans
City of Fort Worth
Mpact (founded as Rail~Volution)
City of Camden Redevelopment Agency
City of Astoria
City of Portland
City of Laramie