


Recent data showing declining transit ridership is only the latest news to cast doubt on expectations of a public transit renaissance.

The Bureau of Transportation Statistics recently released preliminary data summarizing public transportation ridership in the United States for the calendar year 2015. The preliminary data from the National Transit Data program showed transit ridership in 2015 of 10.4 billion annual riders approximately 2.5% below the 2014 count and also smaller than the 2013 count. The American Public Transit Association using a slightly different methodology released data showing 10.6 billion annual riders versus 10.7 billion in calendar year 2014, a 1.26% year-over-year decline. Such differences between sources are common, resulting from differences in methodology and definitions, and unsurprising, given that data is preliminary and national data is dependent upon reporting from hundreds of different agencies.
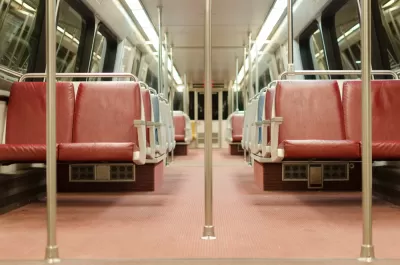
It is important to recognize that it’s extraordinarily difficult to consistently grow transit ridership. We have had growing population, a rebounding economy, growing total employment, and an aggressively argued hypothesis that the millennial generation is meaningfully different than their forefathers—with urban centric aspirations and indifference toward auto ownership and use. Yet, transit ridership has remained stubbornly modest.
|
Indicator |
2015 versus 2014 |
Source |
|
U.S. Population |
+0.8% |
Census |
|
Total Employment |
+1.7% |
BLS |
|
Real GDP |
+2.4% |
BEA (third estimate) |
|
Gas Price |
-28% |
EIA |
|
VMT |
+3.5% |
FHWA |
|
Public Transit Ridership |
-1.3% to -2.5% |
APTA and NTD |
|
Amtrak Ridership (FY) |
-0.1% |
Amtrak |
|
Airline Passengers |
+5.0% |
The rebound in national vehicle miles traveled totals in 2015 (+3.5%) grabbed attention, as many had anticipated continued moderation. Couple that with modest declines in transit and Amtrak use and strong airline traffic growth, and one could argue the new normal for travel trends is looking more like the old normal.
When I entered full-time employment with a transit agency in 1980, industry leaders were touting the growth opportunities for public transit in light of the energy shortages in the late '70s. Throughout the intervening time, there have been myriad seemingly logical events that led to expectations of strong transit growth. Growing congestion, a growing appreciation of the role of transportation in influencing land-use, growing federal support, increasing gasoline prices, expansion of rail systems, sensitivity to the safety benefits of transit travel, potential economic benefits for passengers who reduce auto ownership and use costs, air quality concerns and, subsequently, climate impact concerns, and, more have collectively created almost perpetual expectations of a more promising future for public transportation. Indeed, transit ridership has grown some since its low point in the early '70s and subsequent dip in the mid-'90s, but the often-expected, sustained, or robust growth has never materialized.
More recently, demographic conditions, such as growing urbanization, declining driver's-license-holding and auto-ownership rates for young people, and evidence that the love affair with the automobile has waned, have renewed expectations. Sprinkle in technology enhancements that enable real-time information, robust trip planning, automated and more convenient fare collection, and integrated first-mile last-mile opportunities; add a dash of heightened concerns about climate change; and there remains a credible argument that transit has a bright future.
An often-cited constraint on the growth of public transit has been the assertion of resource constraints for providing the quality of service that would be attractive to more travelers who have other options. While transit supply remains well below the aspirational levels of many transit users and transit advocates, the data in the graph below indicates that supply has grown far more rapidly than demand for the past several decades. This is a report card on productivity that mom and dad would hardly be proud of. And a larger share of the ridership has moved to more capital intensive (and larger vehicle capacity) rail systems.

Gas prices have certainly been a factor in recent trends, but they can’t explain the fact that growing transit ridership seems as tough as getting bipartisan harmony in the nation's legislative bodies. Some cities are moving headlong into a more transit intensive future with aspirations of big ridership growth, like Seattle, where aggressive, multi-decade plans with big local funding commitment requests promise more transit supply. Other areas like Washington, D.C. are digesting the reality that more resources are required to sustain existing services, maintain infrastructure and meet underfunded pension obligations. The factors supporting or opposing ridership growth are numerous, with uncertainties dominating the lists.

I generally like to have a theoretically robust basis for speculating on the future, but in light of the complexity of factors involved and the uncertainty in their trends, transit ridership forecasts are speculative. The per capita transit ridership trend in the graph below (red line) is a pretty straight horizontal line since about 1970 and just might be pointing to the future. History tells us to be careful in presuming we understand causal factors governing complex behaviors; if anything the degree of uncertainty is greater than ever.
Transit remains very important to each trip maker but how many trips are made in the future remains a guess, one that should be informed by a keen understanding of travel behavior and history and not just aspirations.

The opinions are those of the author—or maybe not—but are intended to provoke reflection and do not reflect the policy positions of any associated entities or clients. [email protected].

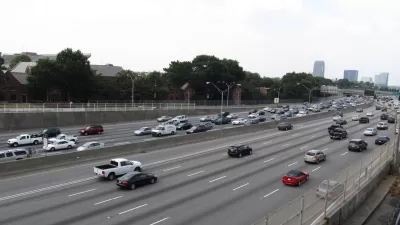
Faced With Infamously Bad Traffic, More Atlanta Residents Choose to Telecommute
More people are telecommuting in Atlanta, keeping cars of the road, but the percentages of people driving alone to work, taking transit, and walking or biking to work are holding steady.
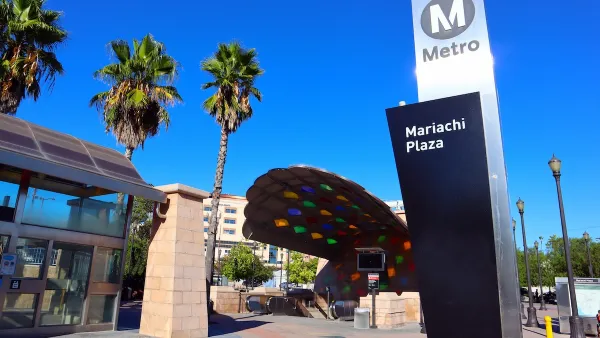
High Housing Costs Driving Down Transit Ridership in LA
When neighborhoods gentrify and displace lower-income residents, transit ridership suffers, new research shows.
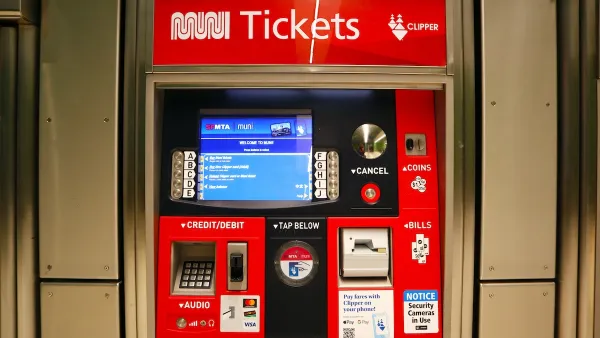
San Francisco Muni Raises Fares a Second Time
A 10–cent fare hike for adults is part of the agency’s plan to chip away at a growing budget deficit.

Planetizen Federal Action Tracker
A weekly monitor of how Trump’s orders and actions are impacting planners and planning in America.

Congressman Proposes Bill to Rename DC Metro “Trump Train”
The Make Autorail Great Again Act would withhold federal funding to the system until the Washington Metropolitan Area Transit Authority (WMATA), rebrands as the Washington Metropolitan Authority for Greater Access (WMAGA).

The Simple Legislative Tool Transforming Vacant Downtowns
In California, Michigan and Georgia, an easy win is bringing dollars — and delight — back to city centers.

The States Losing Rural Delivery Rooms at an Alarming Pace
In some states, as few as 9% of rural hospitals still deliver babies. As a result, rising pre-term births, no adequate pre-term care and "harrowing" close calls are a growing reality.

The Small South Asian Republic Going all in on EVs
Thanks to one simple policy change less than five years ago, 65% of new cars in this Himalayan country are now electric.

DC Backpedals on Bike Lane Protection, Swaps Barriers for Paint
Citing aesthetic concerns, the city is removing the concrete barriers and flexposts that once separated Arizona Avenue cyclists from motor vehicles.
Urban Design for Planners 1: Software Tools
This six-course series explores essential urban design concepts using open source software and equips planners with the tools they need to participate fully in the urban design process.
Planning for Universal Design
Learn the tools for implementing Universal Design in planning regulations.
Smith Gee Studio
City of Charlotte
City of Camden Redevelopment Agency
City of Astoria
Transportation Research & Education Center (TREC) at Portland State University
US High Speed Rail Association
City of Camden Redevelopment Agency
Municipality of Princeton (NJ)